Introduction
How to read financial statements for beginners is one of the most important skills every investor should learn. Financial statements reveal how a company earns money, spends money, and manages its assets and liabilities.
Whether you are investing in stocks, analyzing a startup, or evaluating a large corporation, understanding financial statements allows you to see the real financial health of a business.
Financial literacy is one of the most powerful skills an investor can develop. Whether you are investing in stocks, analyzing a startup, or evaluating a large corporation, the ability to read financial statements allows you to understand the true financial health of a business.
Many beginner investors in countries like the United States, Canada, the United Kingdom, Australia, and other developed economies often focus on stock prices, news headlines, or social media trends. However, professional investors rely on something far more powerful: financial statements.
Financial statements are the official reports that show how a company earns money, spends money, and manages its assets and liabilities. By learning how to read these reports, investors gain insight into whether a company is profitable, financially stable, and capable of growing in the future. Understanding how to read financial statements for beginners is an essential part of financial analysis because it helps investors evaluate the financial health of a company.
In this comprehensive guide, you will learn:
- What financial statements are
- The three main financial statements every investor must understand
- How to interpret the numbers inside them
- Key financial ratios used by professional investors
- Real-world examples and case studies
By the end of this guide, you will be able to analyze a company’s financial health like a professional investor.Income Statement
What Are Financial Statements?
Financial statements are official reports that show a company’s revenue, expenses, assets, liabilities, and cash flow. Investors use them to evaluate profitability, financial stability, and long-term growth potential.
Public companies publish financial statements regularly so investors, analysts, and regulators can evaluate business performance.
Example section:
How to Read Financial Statements For Beginners (Video Guide)
Chapter 1: What Are Financial Statements?
Financial statements are official documents that summarize a company’s financial performance and position over a specific period.
Public companies listed on stock exchanges are legally required to publish financial statements so investors can evaluate the company before investing.
These reports are typically released:
- Quarterly (every 3 months)
- Annually (once per year)
In the United States, companies file these reports with the SEC (Securities and Exchange Commission) through documents such as:
- 10-Q (Quarterly Report)
- 10-K (Annual Report)
These reports contain detailed financial statements along with management discussions and risk factors.
Financial statements help answer critical questions such as:
- Is the company profitable?
- Does it have too much debt?
- Is revenue growing or declining?
- Can the company survive economic downturns?
For investors, these answers determine whether a company is worth investing in.
Chapter 2: The Three Financial Statements Every Investor Must Understand
Public companies publish detailed company financial reports every quarter and every year so investors can evaluate their performance and financial stability.
Many beginner investors learn the basics of financial statements through financial education websites such as Investopedia, which explains accounting terms, ratios, and financial reports in simple language. Every public company publishes three primary financial statements.
These are:
- Income Statement
- Balance Sheet
- Cash Flow Statement
Every public company publishes three primary financial statements. Each statement reveals a different part of a company’s financial health and helps investors understand how the business performs.
Professional investors always analyze all three together because one statement alone cannot tell the full story.
Comparison of the Three Financial Statements
| Statement | Shows | Purpose |
|---|---|---|
| Income Statement | Revenue & expenses | Profitability |
| Balance Sheet | Assets & liabilities | Financial position |
| Cash Flow | Cash movement | Liquidity |
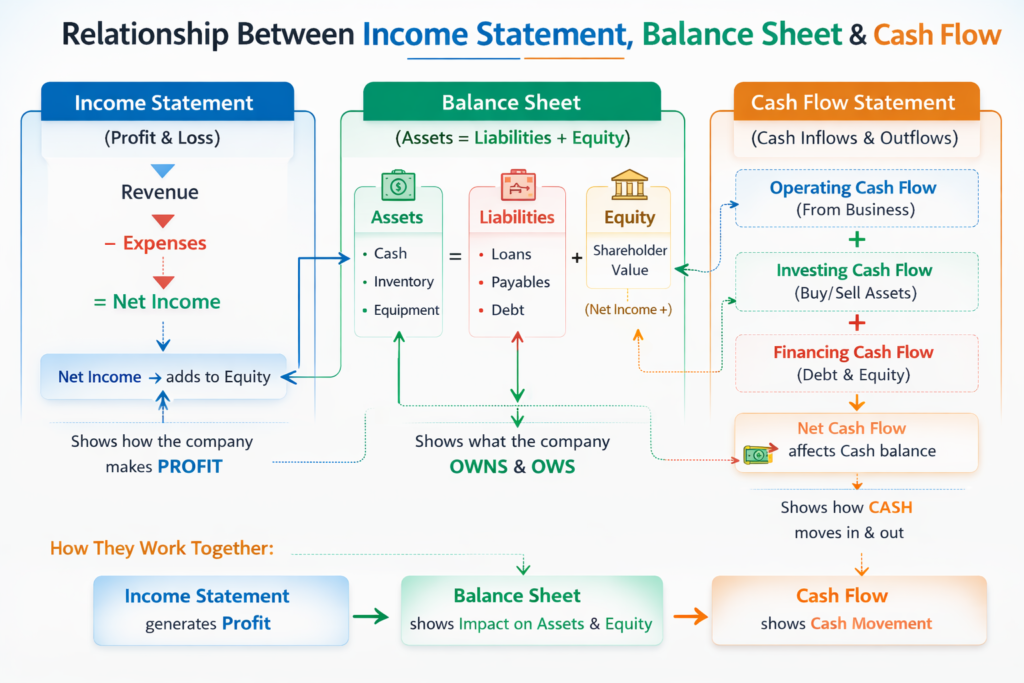
Professional investors analyze all three together because one statement alone cannot provide the full picture. These three statements work together to provide a complete financial picture of a business.
What Are the Three Financial Statements?
The three financial statements are the income statement, balance sheet, and cash flow statement. Together they show a company’s profitability, financial position, and cash movement.
For example, a company might report strong profits on its income statement but still struggle with cash flow. That is why professional investors examine all three reports before making investment decisions.
Chapter 3: How to Read Financial Statements for Beginners: Income Statement
The Income Statement shows how much money a company earns and spends over a specific period. Learning how to read financial statements for beginners starts with understanding the income statement.
It answers one simple question:
Did the company make a profit?
Basic Structure
The typical income statement follows this format:
Revenue
− Cost of Goods Sold
= Gross Profit
Gross Profit
− Operating Expenses
= Operating Income
Operating Income
− Taxes & Interest
= Net Profit
Let’s break these down.
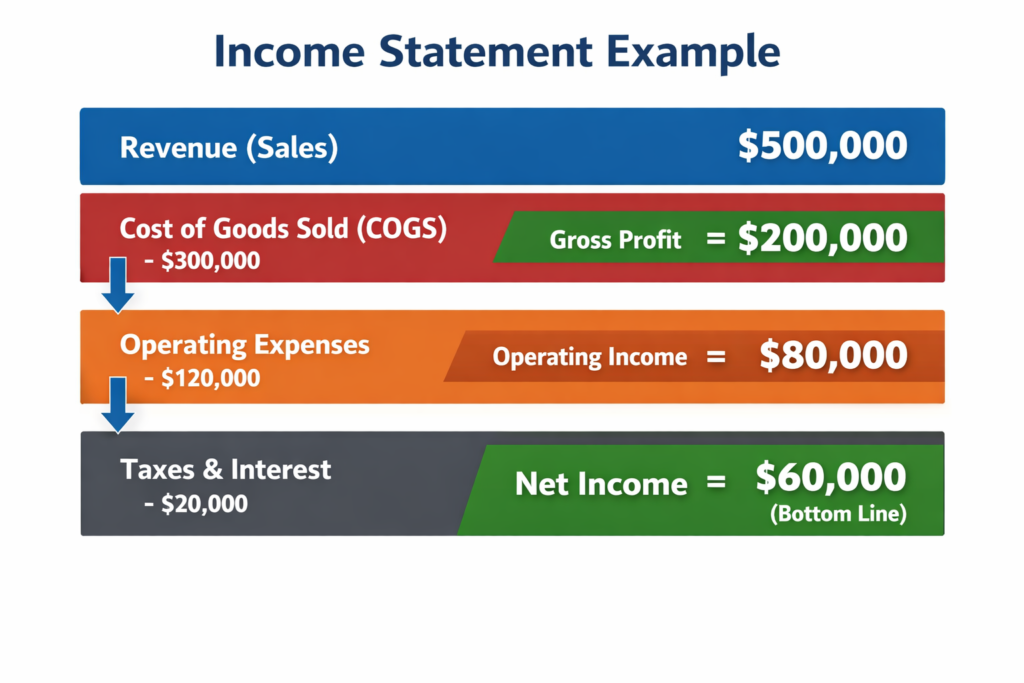
Below is a simple income statement example that shows how revenue turns into net profit after subtracting costs and expenses.
Income Statement Example Diagram
An Income Statement diagram visually explains how a company moves from revenue to net profit. It shows how sales turn into profit after subtracting costs and expenses.
The structure usually follows this order:
Revenue → Cost of Goods Sold → Gross Profit → Operating Expenses → Operating Income → Taxes → Net Income
Step-by-Step Explanation
1. Revenue (Top Line)
Revenue is the total money earned from selling products or services.
Examples:
- Product sales
- Service revenue
- Subscription income
Example:
Revenue = $500,000
2. Cost of Goods Sold (COGS)
COGS represents the direct costs required to produce the product or service.
Examples:
- Raw materials
- Manufacturing labor
- Production costs
Example:
COGS = $300,000
3. Gross Profit
Gross Profit shows how much money remains after production costs.
Formula:
Gross Profit = Revenue − COGS
Example:
$500,000 − $300,000 = $200,000
4. Operating Expenses
Operating expenses are the costs required to run the business.
Examples:
- Salaries
- Marketing
- Office rent
- Research and development
Example:
Operating Expenses = $120,000
5. Operating Income
Operating income represents profit generated from the company’s core operations.
Formula:
Operating Income = Gross Profit − Operating Expenses
Example:
$200,000 − $120,000 = $80,000
6. Taxes and Interest
Companies must pay taxes and interest on loans.
Example:
Taxes & Interest = $20,000
7. Net Income (Bottom Line)
Net income is the final profit after all expenses.
Formula:
Net Income = Operating Income − Taxes − Interest
Example:
$80,000 − $20,000 = $60,000
This is often called the “Bottom Line” because it appears at the bottom of the income statement.
Simple Income Statement Example
| Item | Amount |
|---|---|
| Revenue | $500,000 |
| Cost of Goods Sold | -$300,000 |
| Gross Profit | $200,000 |
| Operating Expenses | -$120,000 |
| Operating Income | $80,000 |
| Taxes & Interest | -$20,000 |
| Net Income | $60,000 |
Chapter 4: How to Read a Balance Sheet
Investors perform balance sheet analysis to understand a company’s assets, liabilities, and overall financial stability. Another important step in how to read financial statements for beginners is understanding the balance sheet.
The Balance Sheet provides a snapshot of a company’s financial position at a specific moment. To fully understand how to read financial statements for beginners, investors must also learn how to interpret a balance sheet.
It shows:
- What the company owns
- What the company owes
- What shareholders own
The balance sheet follows a simple accounting equation:
Assets = Liabilities + Shareholders’ Equity
Balance Sheet Structure Explained
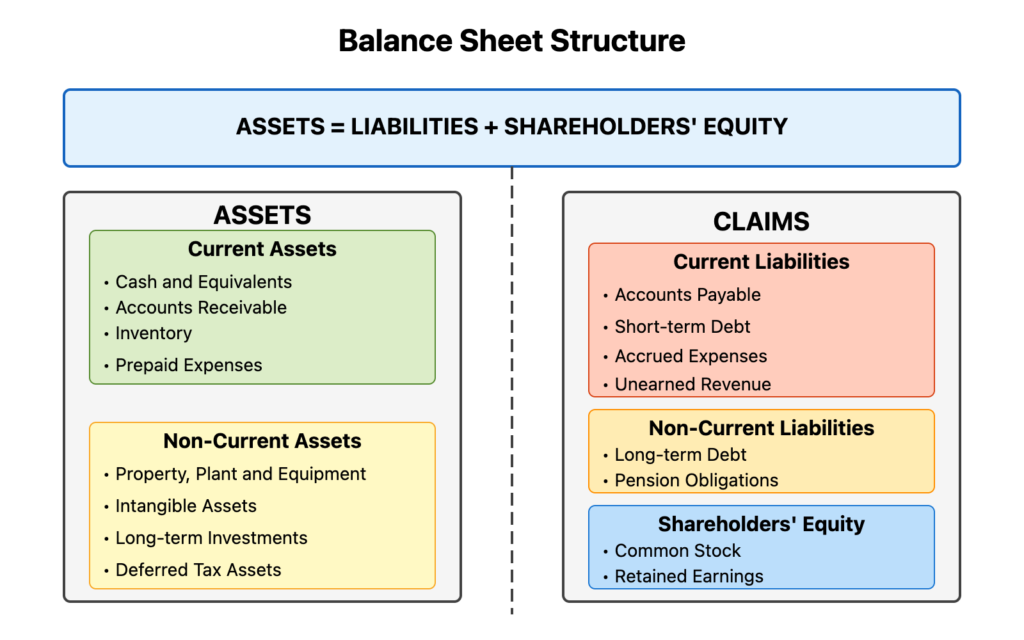
A balance sheet shows the financial position of a company at a specific point in time. It follows the fundamental accounting equation:
Assets = Liabilities + Shareholders’ Equity
This means everything the company owns is financed either by debt (liabilities) or owners’ capital (equity).
1. Assets (What the Company Owns)
Assets are resources that provide future economic value.
Current Assets
Assets expected to be converted into cash within 1 year.
Examples:
- Cash
- Accounts receivable
- Inventory
- Short-term investments
Non-Current Assets
Long-term resources used to operate the business.
Examples:
- Buildings
- Equipment
- Machinery
- Patents and intellectual property
Example:
| Asset Type | Value |
|---|---|
| Cash | $500,000 |
| Inventory | $200,000 |
| Equipment | $300,000 |
| Total Assets | $1,000,000 |
2. Liabilities (What the Company Owes)
Liabilities are obligations the company must pay.
Current Liabilities
Short-term obligations due within 1 year.
Examples:
- Accounts payable
- Short-term loans
- Taxes payable
Long-Term Liabilities
Debts due over many years.
Examples:
- Bank loans
- Corporate bonds
- Lease obligations
Example:
| Liability Type | Value |
|---|---|
| Accounts Payable | $150,000 |
| Short-term Loan | $100,000 |
| Long-term Debt | $250,000 |
| Total Liabilities | $500,000 |
3. Shareholders’ Equity (Owner’s Value)
Equity represents the ownership value of shareholders after all debts are paid.
Formula:
Equity = Assets − Liabilities
Example:
Assets = $1,000,000
Liabilities = $500,000
Equity = $500,000
Simple Balance Sheet Example
| Assets | Liabilities & Equity |
|---|---|
| Cash $200,000 | Accounts Payable $100,000 |
| Inventory $150,000 | Bank Loan $200,000 |
| Equipment $650,000 | Shareholder Equity $700,000 |
| Total $1,000,000 | Total $1,000,000 |
Both sides must always balance.
Why This Diagram Is Important for Investors
Investors use the balance sheet to understand:
- Financial stability
- Debt levels
- Asset strength
- Liquidity risk
For example:
A company with high assets and low debt is usually financially strong.
But a company with too much debt may struggle during economic downturns.
Chapter 5: How to Read a Cash Flow Statement
The following cash flow statement example shows how operating, investing, and financing activities affect a company’s total cash position. The cash flow statement is a critical part of how to read financial statements for beginners because it reveals real cash movement.
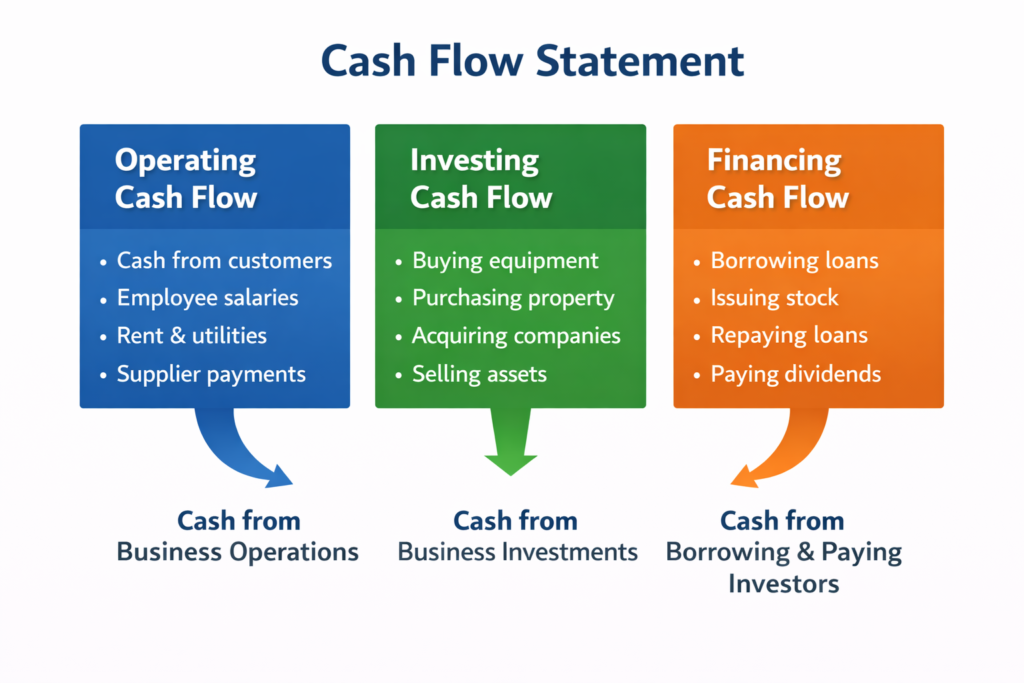
Cash Flow Statement Diagram (Operating, Investing, Financing)
A cash flow statement diagram visually explains the three main sections of a company’s cash flow. This helps investors quickly understand where money is coming from and where it is going. Another key step in how to read financial statements for beginners is analyzing the cash flow statement.
The three sections are:
- Operating Cash Flow
- Investing Cash Flow
- Financing Cash Flow
Together they show how cash moves through a business.
1. Operating Cash Flow (Core Business Activities)
Operating cash flow represents the cash generated from a company’s normal operations.
This section answers an important question:
👉 Is the company’s main business actually generating cash?
Examples of Operating Cash Flow
Cash inflows:
- Cash received from customers
- Service revenue
Cash outflows:
- Employee salaries
- Rent and utilities
- Supplier payments
Example
| Item | Amount |
|---|---|
| Cash from customers | $500,000 |
| Salary payments | -$200,000 |
| Supplier payments | -$100,000 |
Operating Cash Flow = $200,000
Positive operating cash flow is a strong sign of a healthy business.
2. Investing Cash Flow (Business Investments)
Investing cash flow shows how much money the company spends on long-term assets or investments.
These activities help the company grow in the future.
Examples
Cash outflows:
- Buying equipment
- Purchasing property
- Acquiring other companies
Cash inflows:
- Selling assets
- Selling investments
Example
| Item | Amount |
|---|---|
| Purchase equipment | -$80,000 |
| Sell old machinery | +$20,000 |
Investing Cash Flow = -$60,000
Negative investing cash flow often means the company is investing in growth.
3. Financing Cash Flow (Funding the Business)
Financing cash flow shows how the company raises money and returns money to investors.
Examples
Cash inflows:
- Issuing new shares
- Borrowing loans
Cash outflows:
- Paying dividends
- Repaying loans
- Share buybacks
Example
| Item | Amount |
|---|---|
| Loan received | +$100,000 |
| Loan repayment | -$40,000 |
| Dividend payment | -$20,000 |
Financing Cash Flow = $40,000
Example of Complete Cash Flow
| Section | Cash Flow |
|---|---|
| Operating Cash Flow | $200,000 |
| Investing Cash Flow | -$60,000 |
| Financing Cash Flow | $40,000 |
Net Cash Flow = $180,000
Why Investors Analyze Cash Flow
Investors use the cash flow statement to determine:
✔ whether a company generates real cash
✔ whether the company is investing in growth
✔ how the company finances its operations
Some companies show high profits but poor cash flow, which is a warning sign.
Legendary investors like Warren Buffett often emphasize cash flow when evaluating businesses.
Chapter 6: Financial Ratios Used in Financial Statement Analysis
Financial ratios simplify complex financial data. In this section, we will provide financial ratios explained in simple terms so beginner investors can understand how professionals evaluate companies.
Here are some of the most important ratios used by professional investors.
Price-to-Earnings Ratio (P/E)
The P/E ratio measures how expensive a stock is relative to its earnings.
Formula:
P/E Ratio = Stock Price ÷ Earnings Per Share
Example:
Stock price = $100
Earnings per share = $5
P/E = 20
A higher P/E may indicate strong growth expectations.
Debt-to-Equity Ratio
This ratio measures how much debt a company uses relative to shareholder equity.
Formula:
Debt-to-Equity = Total Debt ÷ Shareholder Equity
Lower ratios generally indicate lower financial risk.
Profit Margin
Profit margin shows how much profit a company keeps from its revenue.
Formula:
Profit Margin = Net Income ÷ Revenue
Example:
Revenue = $100 million
Net Income = $20 million
Profit margin = 20%
Higher margins usually indicate strong competitive advantages.
Table 3 (Financial Ratios)
| Ratio | Formula | Purpose |
|---|---|---|
| P/E Ratio | Price ÷ Earnings | Valuation |
| Debt-to-Equity | Debt ÷ Equity | Financial risk |
| Profit Margin | Net Income ÷ Revenue | Profitability |
Chapter 7: Real Example of Financial Statement Analysis
Let’s analyze a hypothetical company called TechNova Inc.
Income Statement
Revenue: $1 billion
COGS: $400 million
Gross Profit: $600 million
Operating Expenses: $350 million
Operating Income: $250 million
Taxes & Interest: $50 million
Net Income: $200 million
Profit Margin:
200 million ÷ 1 billion = 20%
This indicates strong profitability.
Balance Sheet
Assets: $3 billion
Liabilities: $1.5 billion
Shareholder Equity:
3B − 1.5B = $1.5 billion
The company has a balanced financial structure.
Cash Flow
Operating Cash Flow: $350 million
Investing Cash Flow: −$150 million
Financing Cash Flow: −$50 million
This indicates the company is generating strong cash while investing in growth.
Table 2 (Income Statement)
| Item | Meaning |
|---|---|
| Revenue | Total sales |
| COGS | Production costs |
| Gross Profit | Revenue – COGS |
| Operating Income | Profit from operations |
| Net Income | Final profit |
Chapter 8: Common Financial Statement Mistakes Beginners Make
Many beginner investors misinterpret financial statements.
Here are common mistakes.
1. Focusing Only on Revenue
High revenue does not guarantee profit.
Companies must control expenses.
2. Ignoring Debt
Companies with excessive debt can collapse during economic downturns.
3. Ignoring Cash Flow
Profit does not always equal cash.
Cash flow reveals true financial strength.
4. Looking at One Year Only
Professional investors analyze 5–10 years of financial data.
This reveals long-term trends.
Chapter 9: Where to Find Financial Statements
Financial statements are publicly available.
Investors can access them through:
Company investor relations websites
Government financial filings
Stock market research platforms
Examples include:
- SEC filings (U.S.) – Public companies must file detailed financial reports with the SEC, including annual and quarterly filings.
- Company annual reports
- Financial data platforms
Reading original financial reports is the best way to avoid misinformation.
Investors can also learn about financial reports and company filings through stock exchange education centers such as Nasdaq, which provides educational resources about financial statements and investing.
Financial statements can typically be found through:
Stock exchange databases
Company investor relations pages
Government regulatory filings
Chapter 10: Why Financial Statements Matter for Investors
Understanding financial statements provides a major advantage in investing.
Investors who rely solely on news headlines or social media speculation often make poor decisions.
Financial statements allow investors to:
- Identify profitable companies
- Avoid financially weak businesses
- Detect accounting problems
- Compare companies objectively
Legendary investors such as Warren Buffett emphasize studying financial statements before investing.
Buffett famously spends hours reading company reports to identify strong businesses.
FAQ: How to Read Financial Statements
Final Thoughts
Learning to read financial statements is one of the most valuable skills an investor can develop. Once you understand how to read financial statements for beginners, you can analyze companies more confidently and make better investment decisions.
Although financial reports may appear complex at first, they follow consistent structures that become easier to understand with practice.
By focusing on the three core financial statements:
- Income Statement
- Balance Sheet
- Cash Flow Statement
and by analyzing key financial ratios, investors can gain a deep understanding of a company’s financial health.
Over time, this knowledge helps investors make smarter, evidence-based investment decisions.
In the long run, the ability to analyze financial statements can mean the difference between speculative investing and disciplined wealth building.
Learning how to read financial statements for beginners takes practice, but it becomes one of the most valuable investing skills.