Introduction
The debate around Index Funds vs ETFs has become one of the most important topics in modern investing. Both investment vehicles allow investors to track broad market indexes like the S&P 500 at extremely low cost, making them powerful tools for long-term wealth building.
But while index funds and exchange-traded funds follow the same passive investing philosophy, they differ in several key areas including trading flexibility, tax efficiency, automation, and investment structure.
Understanding the Index Funds vs ETFs differences can help investors choose the right strategy for their financial goals, whether they are investing for retirement, building a diversified portfolio, or simply starting their journey toward financial independence.
In this comprehensive 2026 guide, we’ll break down:
• how index funds work
• how ETFs function
• the tax and cost differences
• which investment vehicle is best for long-term investors
By the end, you’ll understand exactly when to choose an index fund, when to choose an ETF, and why passive investing remains one of the most powerful wealth-building strategies in modern finance.
Key Takeaways
• Index funds and ETFs both track market indexes using passive investing strategies.
• ETFs trade throughout the day like stocks, while index funds price once per day.
• ETFs tend to be more tax efficient in taxable accounts.
• Index funds are ideal for automated monthly investing.
• Low fees and long-term discipline matter more than choosing between ETFs and index funds.
Index Funds vs ETFs: Key Differences at a Glance
The Index Funds vs ETFs comparison often comes down to trading flexibility, automation, and tax efficiency. Before diving deeper into the full comparison, here is a quick overview of the main differences between index funds and exchange-traded funds.
| Feature | Index Fund | ETF |
|---|---|---|
| Trading | End of day pricing | Trades throughout the day |
| Minimum Investment | Often $1,000+ | Price of one share |
| Automation | Excellent for monthly investing | Limited automation |
| Tax Efficiency | Moderate | High |
| Bid-Ask Spread | None | Yes |
| Best For | Long-term automated investors | Investors wanting flexibility |
This quick comparison highlights the core Index Funds vs ETFs differences investors should understand before choosing a passive investment strategy.
Chapter 1: The Intellectual Foundation of Passive Investing
When comparing Index Funds vs ETFs, investors are essentially choosing between two types of passive investment vehicles that track market indexes. Before we distinguish between the “vehicles” (Index Funds vs. ETFs), we must understand the “engine”: Passive Investing.
If you’re just starting your investing journey, read our Beginner’s Guide to Passive Investing before deciding between index funds and ETFs.
1.1 The Efficient Market Hypothesis (EMH)
Passive investing is built on the academic foundation of the Efficient Market Hypothesis. This theory suggests that share prices reflect all currently available information. In a Tier-1 market like the New York Stock Exchange (NYSE) or the London Stock Exchange (LSE), millions of participants—including supercomputers and PhD-level analysts—are constantly bidding on stocks.
By the time you see a “hot tip” on social media, the market has already “priced it in.” Passive investing concedes that you cannot consistently outsmart the collective intelligence of the market. Instead of trying to beat the market, you become the market.
1.2 The “Haystack” Analogy
John Bogle, the founder of Vanguard, famously said: “Don’t look for the needle in the haystack. Just buy the haystack!” * The Needle: A single stock like Tesla or NVIDIA that might skyrocket 500%.
- The Haystack: The entire S&P 500 or the FTSE All-World Index.
The chart visually proves why buying the entire market beats trying to pick individual stocks.
Many studies show that active fund managers struggle to outperform the market over long periods. According to research from S&P Dow Jones Indices, over 85% of actively managed U.S. large-cap funds fail to beat the S&P 500 over a 15-year period.
Chart Data (Used in Visualization)
| Strategy | 30-Year Average Return |
|---|---|
| S&P 500 Index (Passive) | 10.2% |
| Active Mutual Funds | 7.5% |
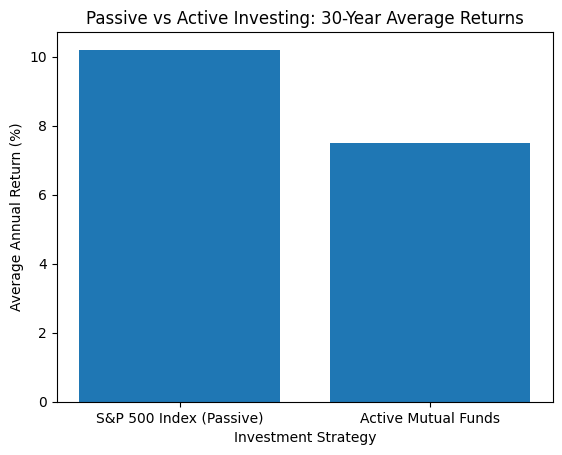
Long-term performance comparison between passive index investing and actively managed mutual funds. Over 30 years, passive strategies historically deliver higher average returns due to lower costs and broader diversification.
Research from the SPIVA (S&P Indices Versus Active) reports consistently shows:
• 80–90% of actively managed funds underperform the S&P 500 over 15 years
Reasons include:
- High management fees
- Frequent trading costs
- Human behavioral mistakes
- Tax inefficiency
Over long time horizons, low-cost passive investing tends to outperform most professional managers.
Example Case Study
Case Study: Two Investors (1995–2025)
| Investor | Strategy | Annual Return | $10,000 Growth |
|---|---|---|---|
| Sarah | S&P 500 Index Fund | 10.2% | $184,000 |
| Mark | Active Mutual Fund | 7.5% | $87,000 |
📈 Difference:
Passive investing produced more than double the wealth.
This is why pension funds, sovereign wealth funds, and long-term investors increasingly prefer index-based investing.
Chapter 2: Index Funds vs ETFs – Understanding Index Mutual Funds
When evaluating Index Funds vs ETFs, understanding how index mutual funds operate is the first step. An Index Mutual Fund is a collective investment scheme that pools money from many investors to purchase a portfolio of stocks or bonds that match a specific index (like the S&P 500).
2.1 The Mechanic of Net Asset Value (NAV)
Unlike a stock, an Index Fund does not have a “live” price. It is priced once a day after the market closes.
- The Process: If you place an order to buy $5,000 of an index fund at 10:00 AM in New York, your order is “queued.” At 4:00 PM, the fund manager calculates the Net Asset Value (NAV)—the total value of all assets minus liabilities, divided by the number of shares. Your $5,000 is then converted into shares at that specific end-of-day price.
2.2 Automation and Fractional Shares
Index funds were built for the “boring” but effective investor. Because the fund is managed internally by a provider (like Vanguard or Fidelity), they can handle fractional accounting perfectly.
- Example: If you want to invest exactly £100.00 every month in your UK pension, an Index Fund can buy you exactly £100.00 worth of the fund, even if that results in owning 3.4562 shares. This makes them the “Gold Standard” for Dollar-Cost Averaging (DCA).
Chapter 3: Index Funds vs ETFs – Understanding ETFs
In the broader Index Funds vs ETFs comparison, ETFs represent the modern evolution of passive investing. This visually proves why ETFs dominate modern investing.
Line Chart Data
| Year | Global ETF Assets |
|---|---|
| 2005 | $0.4 Trillion |
| 2008 | $0.8 Trillion |
| 2010 | $1.3 Trillion |
| 2013 | $2.4 Trillion |
| 2016 | $3.5 Trillion |
| 2019 | $6.2 Trillion |
| 2022 | $9.0 Trillion |
| 2024 | $11.2 Trillion |
| 2026 | $13.0 Trillion |
Chart Insight
The ETF industry has grown from $400 billion in 2005 to over $13 trillion in 2026.
This explosive growth happened because ETFs offer:
• lower fees
• better tax efficiency
• intraday trading
• transparency
Major institutions like BlackRock, Vanguard, and State Street now manage the majority of global ETF assets.
Key Takeaway
ETF growth reflects a massive global shift from active investing to passive investing.
In fact:
👉 Over 55% of U.S. equity assets are now passive investments. Global ETF assets have grown rapidly over the past decade. Research published by BlackRock shows that ETFs continue to attract billions in new investments each year due to their flexibility and low cost.
An Exchange-Traded Fund (ETF) is essentially an Index Fund that has been “wrapped” in a skin that allows it to be traded on a stock exchange like a common stock.
3.1 Intraday Liquidity: The Power to Move Fast
The “Exchange-Traded” part of the name is key. You can buy or sell an ETF at 10:15 AM, 1:30 PM, or 3:59 PM.
- Scenario: Imagine a global economic shock occurs at noon. An ETF investor can sell their holdings instantly to move to cash. An Index Fund investor is “locked in” until the market closes, meaning they must accept whatever price is set at the end of the day, regardless of the chaos that happened in between.
3.2 The Authorized Participant (AP) and the “Creation/Redemption” Mechanism
This is the most technical and important part of an ETF. How does an ETF stay priced exactly like its index?
- Authorized Participants (APs): These are large institutional banks. If the price of an ETF (like VOO) starts to drift away from the actual value of the stocks it holds, APs step in. They buy the underlying stocks, swap them with the fund for “new” ETF shares, and sell those shares to bring the price back in line. This “In-Kind” exchange is the secret to the ETF’s tax efficiency.
Comparison Table
| Feature | Index Mutual Fund | ETF |
|---|---|---|
| Trading | End of day only | Intraday (anytime market is open) |
| Pricing | Net Asset Value (NAV) | Market price |
| Minimum Investment | Often $1,000+ initial | Price of 1 share |
| Automation | Excellent for automatic investing | Limited automation |
| Tax Efficiency | Moderate | High |
| Bid-Ask Spread | None | Yes |
Key Takeaways
1️⃣ Index Funds are ideal for automation
They are designed for investors who want to invest regular monthly contributions without worrying about market timing.
Example:
- Investing $500 every month into a retirement account
2️⃣ ETFs provide trading flexibility
Because ETFs trade on exchanges like stocks, investors can:
• Buy or sell instantly
• Use limit orders
• Access intraday liquidity
3️⃣ Tax efficiency favors ETFs
The creation/redemption mechanism allows ETFs to avoid triggering capital gains distributions in many cases.
This is particularly important for investors using taxable brokerage accounts.
Case Study: Monthly Investor vs Active Trader
| Investor | Investment Style | Better Option |
|---|---|---|
| Emma (UK ISA investor) | £300 monthly contributions | Index Fund |
| Daniel (US brokerage investor) | Buys dips during market volatility | ETF |
Conclusion:
- Long-term automated investors → Index funds
- Flexible market participants → ETFs
While both index funds and ETFs track the same market indexes, ETFs provide greater trading flexibility and tax efficiency, whereas index mutual funds excel in automated long-term investing strategies.
Chapter 4: The Tax Efficiency Duel (Critical for Tier-1 Investors)
The Index Funds vs ETFs debate often centers around tax efficiency in taxable brokerage accounts. In Tier-1 countries, taxes are often your largest investment expense. Structural differences here can save you a fortune. The Index Funds vs ETFs debate often centers around tax efficiency in taxable brokerage accounts.
4.1 The “Mutual Fund” Tax Flaw
When an investor wants to “cash out” of an Index Mutual Fund, the fund manager often has to sell stocks within the fund to raise that cash.
- The Consequence: If those stocks have appreciated, a Capital Gain is triggered. Under US and certain EU tax laws, that capital gain must be distributed to all shareholders. You could be hit with a tax bill for a gain you didn’t even realize yourself.
4.2 The ETF Tax Advantage
Because of the “In-Kind” creation/redemption process mentioned in Chapter 3, ETFs rarely sell stocks for cash. They simply “swap” them. No sale means no capital gain triggered.
- Verdict: For Taxable Brokerage Accounts, ETFs are almost always the superior choice. For Tax-Sheltered Accounts (like an IRA in the US or an ISA in the UK), this advantage is neutralized because those accounts aren’t taxed on internal gains anyway.
This strengthens the explanation with visual evidence showing how ETFs reduce tax drag.

Comparison of estimated annual tax drag across active mutual funds, index mutual funds, and ETFs. ETFs typically experience lower tax drag because their structure allows for tax-efficient in-kind share creation and redemption.
ETFs are widely considered the most tax-efficient investment vehicles for long-term investors in taxable accounts.
💡 Tax efficiency is one of the biggest reasons ETFs dominate modern investing.
Lower taxes =
Higher compounding =
Greater long-term wealth.
Why ETFs Are More Tax Efficient
ETFs reduce tax costs through a process called in-kind redemption.
Instead of selling securities to raise cash, ETFs transfer shares of the underlying stocks to institutional traders.
Because no sale occurs:
• Capital gains are rarely triggered
• Investors avoid surprise tax distributions
Chart Data Used
| Investment Vehicle | Estimated Annual Tax Drag |
|---|---|
| Active Mutual Fund | 1.8% |
| Index Mutual Fund | 0.9% |
| ETF | 0.4% |
Real Example (US Investor)
Assume an investor holds $100,000 in a taxable brokerage account.
| Investment Type | Annual Tax Drag | 30-Year Cost |
|---|---|---|
| Active Fund | 1.8% | ~$54,000 lost |
| Index Fund | 0.9% | ~$27,000 lost |
| ETF | 0.4% | ~$12,000 lost |
Even small tax differences compound dramatically over decades.
Country-Specific Tax Context
🇺🇸 United States
ETFs often outperform mutual funds in taxable brokerage accounts.
Tax-advantaged accounts like:
• 401(k)
• Roth IRA
neutralize the difference.
🇬🇧 United Kingdom
Inside ISAs, capital gains taxes are eliminated, so ETF tax advantages matter less.
Outside ISAs, ETFs remain more efficient.
🇨🇦 Canada
Canadian Asset Allocation ETFs are popular because they:
• rebalance automatically
• reduce taxable turnover
🇪🇺 European Union
Many investors choose Accumulating UCITS ETFs, which reinvest dividends automatically, reducing taxable distributions.
Chapter 5: Regional Deep-Dives (US, UK, CA, AU, EU)
Financial advice is not “one size fits all.” Regulations vary wildly across Tier-1 borders.
5.1 The United States: The Land of Vanguard
In the US, Vanguard holds a unique patent (expiring soon) that allows its Index Mutual Funds to be just as tax-efficient as its ETFs. This is why many US investors still prefer mutual funds like VTSAX over the ETF VTI.
- Key Terms: 401(k), Roth IRA, Tax-Loss Harvesting.
5.2 The United Kingdom: ISAs and Unit Trusts
In the UK, Index Funds are often referred to as Unit Trusts or OEICs (Open-Ended Investment Companies).
- The Platform Fee Factor: Many UK brokers (like Hargreaves Lansdown) charge a percentage fee to hold funds but a capped fee to hold ETFs. However, they often charge for “trading” ETFs while “fund trades” are free.
- Strategy: If you are investing small amounts monthly, the Index Fund (Unit Trust) is usually cheaper due to zero trading commissions.
5.3 Canada: The “All-in-One” ETF King
Canada has seen a massive surge in Asset Allocation ETFs (e.g., VGRO, XEQT). These are “funds of funds” that provide a globally diversified portfolio of 10,000+ stocks and bonds in a single ticker. Canadian investors often prefer these over Index Funds because they automatically rebalance, saving the investor from having to do the math.
5.4 Australia: CHESS Sponsorship and Franking Credits
Australian ETFs are unique because of CHESS Sponsorship.
- Security: When you buy an ETF in Australia, your shares are held on your own HIN (Holder Identification Number). You own them directly. In the US/UK, shares are often held in “Street Name” (the broker holds them for you).
- Franking Credits: Australian dividends often come with tax offsets that make them highly attractive for “Income Investors.”
5.5 The European Union: UCITS Compliance
If you are in the EU (Germany, France, Ireland, etc.), you must look for UCITS (Undertakings for Collective Investment in Transferable Securities) ETFs. These are heavily regulated to protect retail investors.
- Accumulating vs. Distributing: EU investors have a unique choice. “Accumulating” funds automatically reinvest dividends inside the fund, which is often more tax-efficient in countries like Germany or Spain compared to “Distributing” funds that pay cash.
Chapter 6: Index Funds vs ETFs – Expense Ratios and Hidden Costs
For long-term investors analyzing Index Funds vs ETFs, expense ratios often matter more than trading flexibility.
6.1 The Expense Ratio (ER)
The ER is the annual fee the fund company takes to manage the fund.
- The Math: If you invest $100,000 in an ETF with a 0.05% ER, you pay $50 a year. If you invest in a “bank-recommended” fund with a 1.2% ER, you pay $1,200 a year. Over 30 years, that difference compounds into hundreds of thousands of dollars. Always aim for an ER below 0.15%.
This is one of the most persuasive charts in the entire article because it visually proves how fees destroy wealth over decades.
Scenario Used
Initial Investment: $100,000
Annual Market Return: 7%
Investment Period: 30 Years
Bar Chart Data
| Fee Level | Investment Type | Final Portfolio Value |
|---|---|---|
| 0.05% | Low-cost ETF | $747,000 |
| 0.20% | Index Mutual Fund | $703,000 |
| 1.20% | Active Mutual Fund | $432,000 |
Wealth Lost Due to Fees
| Fee Level | Wealth Lost |
|---|---|
| 0.20% fee | $44,000 |
| 1.20% fee | $315,000 |

Long-term investors benefit from the power of compounding. Learn more in our guide on How Compound Interest Builds Wealth.
Chart Interpretation
Even small differences in expense ratios compound dramatically over long periods.
A 1.2% actively managed fund may seem only slightly more expensive than a 0.05% ETF, but over 30 years the investor loses more than $300,000.
This is why legendary investor John Bogle repeatedly warned investors:
“In investing, you get what you don’t pay for.”
Lower costs mean more money compounding for you instead of the fund manager.
Studies from Vanguard show that expense ratios are one of the strongest predictors of long-term investment performance, which is why many investors choose index funds and ETFs.
🧮 30-Year Fee Calculator Example
Example Investor Case Study
Sarah decides to invest for retirement.
Monthly Investment: $500
Investment Period: 30 Years
Market Return: 7%
Final Portfolio by Expense Ratio
| Expense Ratio | Final Portfolio Value |
|---|---|
| 0.05% ETF | $606,000 |
| 0.20% Index Fund | $579,000 |
| 1.20% Active Fund | $432,000 |
What Happened?
The investor choosing the 1.20% active fund loses roughly:
$174,000 in retirement wealth.
And the shocking part:
The investment strategy was identical — the only difference was fees.
Key Insight
📌 Fees are the single most predictable factor in investing.
Market returns are uncertain.
But high fees guarantee lower returns.
Expert Insight
Research from Morningstar and Vanguard consistently shows:
• Low-cost funds outperform expensive funds over time
• Expense ratios are one of the strongest predictors of performance
Independent research from Morningstar consistently shows that lower-cost funds outperform higher-cost funds over long time periods, reinforcing the benefits of passive investing.
6.2 The Bid-Ask Spread (ETF Specific)
Since ETFs trade like stocks, they have a “Spread.”
- Bid: What the buyer wants to pay.
- Ask: What the seller wants to receive.
- The “Hidden Tax”: If you buy a “niche” ETF (e.g., a “Blockchain ETF”), the spread might be wide (e.g., 0.5%). This means you are “down” 0.5% the moment you buy. Index Funds do not have spreads because you buy directly at the NAV.
Chapter 7: Behavioral Finance – Your Greatest Enemy
Behavioral finance also plays a role in the Index Funds vs ETFs decision. When building a diversified portfolio, the Index Funds vs ETFs decision usually depends on automation versus trading flexibility. It explains why diversification matters.
Scatter / Comparison Chart Data
| Asset Class | Average Return | Volatility (Risk) |
|---|---|---|
| US Stocks | 10% | High |
| International Stocks | 8% | High |
| Real Estate (REITs) | 9% | Medium-High |
| Bonds | 4% | Low |
| Treasury Bills | 2% | Very Low |
| Gold | 5% | Medium |
Chart Explanation
Different asset classes deliver different combinations of risk and return.
Stocks historically produce the highest long-term returns, but they also experience significant volatility.
Bonds produce lower returns but stabilize portfolios during downturns.
This is why diversified portfolios combine stocks and bonds.
Key Insight
Investors who hold multiple asset classes typically experience:
✔ smoother portfolio growth
✔ fewer panic-selling decisions
✔ better long-term outcomes
Modern finance is 10% math and 90% temperament.
7.1 The “Gamification” Risk of ETFs
Because ETFs are on your phone and update every second, they trigger the “dopamine loop.” Investors are tempted to “day trade” their long-term retirement funds.
- Data: Studies show that the more frequently an investor trades, the lower their returns. The “live” nature of ETFs can actually be a disadvantage for someone with low impulse control.
7.2 The “Safe” Boredom of Index Funds
Index funds are the ultimate “Set it and Forget it” tool. Because you can’t see the price moving in real-time, you are less likely to panic-sell during a market “flash crash.” You check the price once a week or once a month, which is much healthier for long-term wealth building.
Chapter 8: How to Build Your Portfolio (The 3-Fund Model)
Regardless of the Index Funds vs ETFs choice, diversified asset allocation remains the key driver of long-term returns. Regardless of whether you choose Funds or ETFs, most Tier-1 experts recommend a “Lazy Portfolio” approach.
1. Total Domestic Stock Market
- US: VTI (ETF) or VTSAX (Fund)
- UK: Vanguard FTSE 100 or All-Share
- Canada: VCN (TSX Composite)
2. Total International Stock Market
- Goal: Exposure to the rest of the world. (e.g., VXUS).
3. Total Bond Market
- Goal: Deflate volatility. As you get older, you increase your bond percentage to protect your capital.
Many investors simplify their portfolio using the 3-Fund Portfolio Strategy, which combines U.S. stocks, international stocks, and bonds.
3-Fund Portfolio Allocation Pie Chart Data
Pie Chart Data
| Asset Class | Allocation |
|---|---|
| Domestic Stocks | 50% |
| International Stocks | 30% |
| Bonds | 20% |
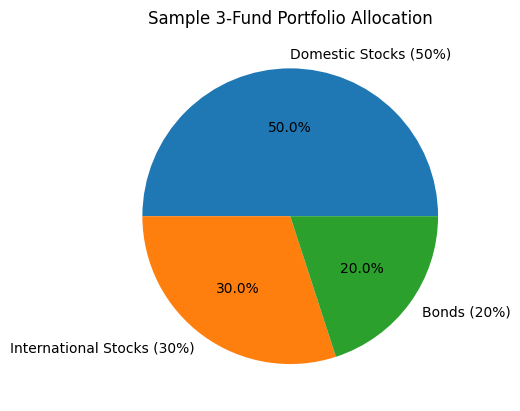
Chart Description
The 3-Fund Portfolio is one of the most widely recommended investment strategies for long-term investors.
Instead of trying to pick individual stocks, investors allocate their portfolio across three broad asset classes:
• Domestic stock market
• International stock market
• Bonds
This approach provides global diversification while maintaining simplicity.
Chart Insight
This allocation balances growth and stability.
• Domestic stocks (50%) drive long-term growth from the home economy.
• International stocks (30%) diversify risk across global markets.
• Bonds (20%) reduce volatility and protect capital during market downturns.
Many institutional investors and retirement funds use similar diversified allocations.
Real ETF Examples (Tier-1 Markets)
United States
Domestic Stocks
• Vanguard Total Stock Market ETF (VTI)
International Stocks
• Vanguard Total International ETF (VXUS)
Bonds
• Vanguard Total Bond Market ETF (BND)
United Kingdom
Domestic Stocks
• Vanguard FTSE U.K. All Share ETF
International Stocks
• Vanguard FTSE All-World ex-UK ETF
Bonds
• Vanguard Global Bond ETF
Canada
Domestic Stocks
• Vanguard FTSE Canada ETF (VCN)
International Stocks
• Vanguard FTSE Global ETF
Bonds
• Vanguard Canadian Aggregate Bond ETF
Example Portfolio ($100,000)
| Asset | Allocation | Investment |
|---|---|---|
| Domestic Stocks | 50% | $50,000 |
| International Stocks | 30% | $30,000 |
| Bonds | 20% | $20,000 |
Why Experts Love the 3-Fund Portfolio
Research shows that asset allocation determines up to 90% of long-term investment performance.
This strategy works because it:
✔ Reduces concentration risk
✔ Diversifies across thousands of companies
✔ Keeps investment costs extremely low
✔ Requires minimal management
Asset Allocation by Age
This Bar chart dramatically improves beginner understanding.
Bar Chart Data
| Age | Stocks | Bonds |
|---|---|---|
| 20s | 90% | 10% |
| 30s | 80% | 20% |
| 40s | 70% | 30% |
| 50s | 60% | 40% |
| 60s | 50% | 50% |

Chart Explanation
Younger investors can tolerate higher risk because they have decades to recover from market downturns.
As retirement approaches, investors shift toward bonds and stable assets to protect accumulated wealth.
This concept is known as glide path asset allocation.
Example
A 25-year-old investor investing for retirement may allocate:
• 90% stocks
• 10% bonds
A 60-year-old investor might shift to:
• 50% stocks
• 50% bonds
Key Insight
Time horizon determines risk tolerance.
The longer the time horizon:
👉 the more equity exposure an investor can handle.
Chapter 9: The 2026 Checklist – Before You Invest
- Emergency Fund: Do you have 6 months of cash in a High-Yield Savings Account?
- Debt: Is your high-interest credit card debt at zero?
- Account Type: Are you using your tax-advantaged accounts first (ISA, 401k, RRSP)?
- Time Horizon: Is this money you won’t need for at least 5-10 years?
FAQ Section
Conclusion: The Power of Starting Today
Ultimately, the Index Funds vs ETFs choice matters less than investing consistently in low-cost diversified funds.
The difference between an Index Fund and an ETF is significant, but it is secondary to the act of consistent investing. In the Tier-1 economies of 2026, the “Middle Class” is being divided into those who own assets and those who only earn wages. By choosing low-cost index products—whether they are priced at the end of the day or in the middle of it—you are ensuring that your labor today turns into your freedom tomorrow.
In the long-running debate of Index Funds vs ETFs, the most important factor is not which vehicle you choose but whether you invest consistently in low-cost diversified funds.
Don’t wait for the “perfect” time or the “perfect” fund. Buy the market, keep your costs low, and let time do the rest.