The 60/40 Portfolio Explained
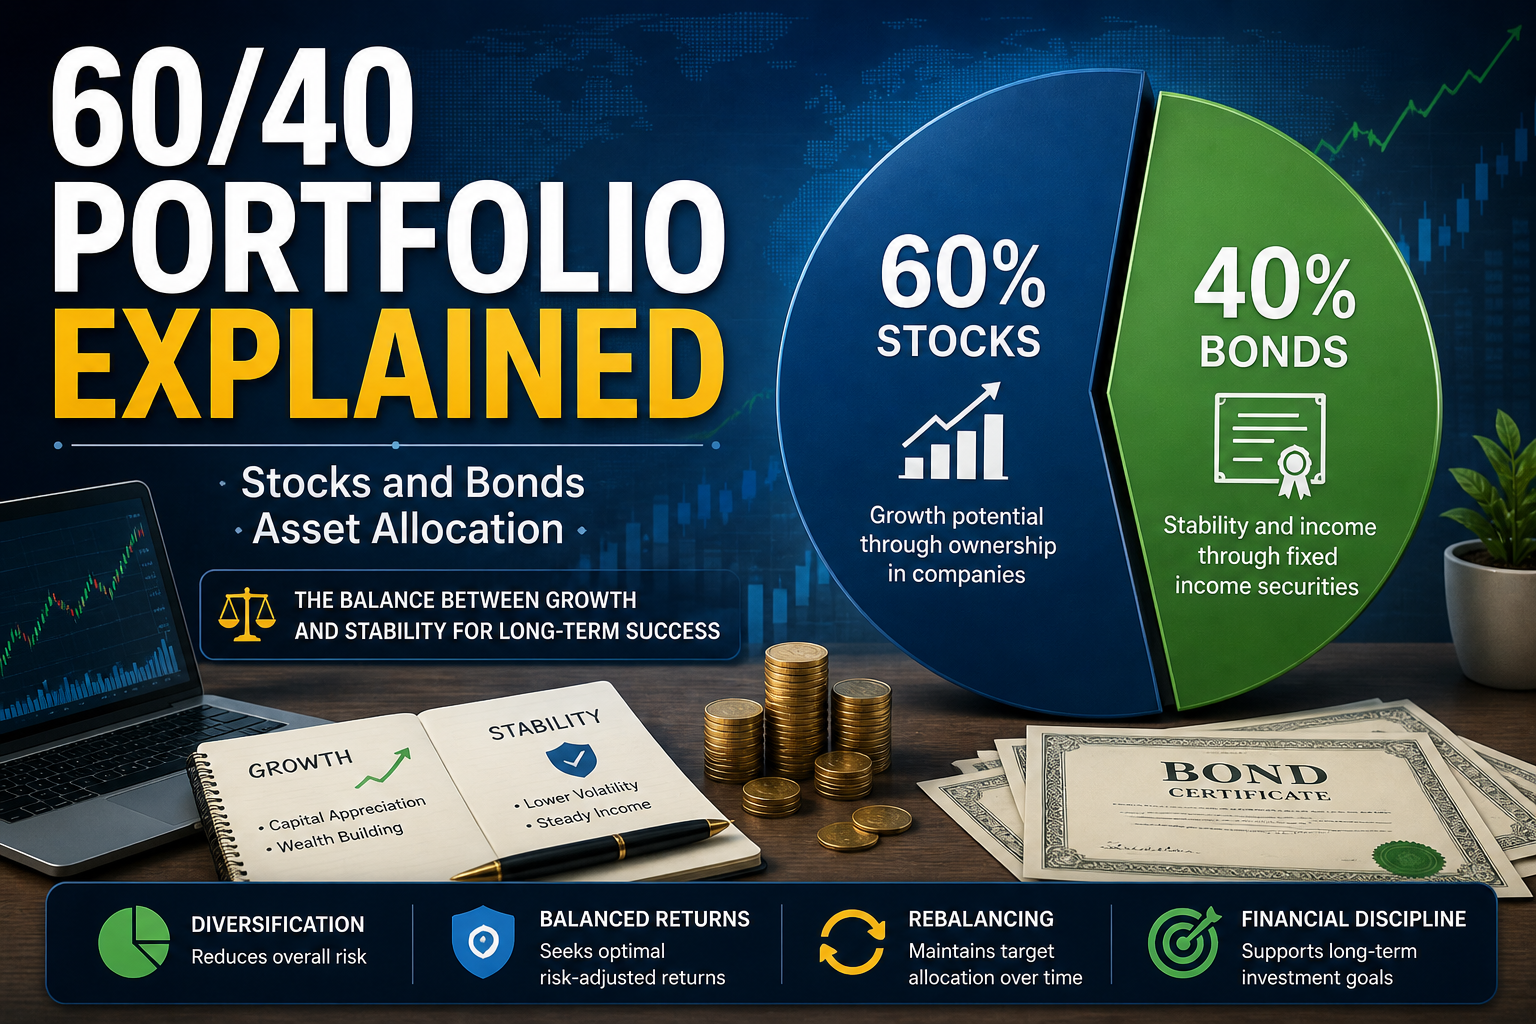
60/40 Portfolio Explained is one of the most widely used investment strategies in the world. By allocating 60% of assets to stocks and 40% to bonds, investors aim to balance growth potential with risk management. This guide explains the 60/40 portfolio, its benefits, risks, historical performance, and real-world examples to help investors build long-term wealth.
It has been used for decades by retirees, pension funds, financial advisors, endowments, and long-term investors across the United States, Canada, the United Kingdom, and Australia.
At its core, the strategy is simple:
- 60% of your money is invested in stocks (equities)
- 40% of your money is invested in bonds (fixed income)
The idea is to create a balance between:
- Growth (from stocks)
- Stability and income (from bonds)
For many investors, the 60/40 portfolio became the “default” long-term investing strategy because it historically provided strong returns with lower volatility than an all-stock portfolio.
But in modern markets, especially after inflation spikes, rising interest rates, and stock market crashes, many investors are asking:
- Does the 60/40 portfolio still work?
- Is it outdated?
- Should younger investors use it?
- How does it perform during recessions?
- What are the risks?
This guide explains everything in detail, including:
- What the 60/40 portfolio means
- Why it became popular
- How stocks and bonds work together
- Historical performance
- Advantages and disadvantages
- Real-world case studies
- Examples for different age groups
- Modern alternatives
- Tax considerations for Tier-1 countries
- How to build one step-by-step
What Is a Portfolio?
Before understanding the 60/40 portfolio, you must understand the meaning of the word portfolio.
A portfolio is a collection of investments owned by an individual or institution.
A portfolio can include:
- Stocks
- Bonds
- ETFs
- Mutual funds
- Real estate
- Cash
- Commodities
Example:
Imagine Sarah from the United States invests:
- $60,000 in stock index funds
- $40,000 in government bonds
Her total investments equal:
$100,000
This collection of investments is called her investment portfolio.
What Does 60/40 Mean?
The numbers refer to asset allocation.
Asset allocation means dividing money among different investment categories.
In a 60/40 portfolio:
| Asset Type | Allocation |
|---|---|
| Stocks | 60% |
| Bonds | 40% |
Example:
If you invest $10,000:
| Investment | Amount |
|---|---|
| Stocks | $6,000 |
| Bonds | $4,000 |
Understanding Stocks
Stocks are also called:
- Equities
- Shares
When you buy a stock, you own a small piece of a company.
Example companies include:
- Apple
- Microsoft
- Amazon
If these companies grow, your investment may increase in value.
Stocks are considered growth assets because they historically produce higher long-term returns.
However, stocks are also volatile.
Volatility means prices can rise or fall quickly.
Example:
During a market crash:
- A stock portfolio might lose 20%–40% in one year.
This risk is why bonds are included in the portfolio.
Understanding Bonds
A bond is essentially a loan.
When you buy a bond, you lend money to:
- Governments
- Corporations
- Municipalities
In return, they pay:
- Interest payments
- Principal repayment at maturity
Examples include:
- U.S. Treasury bonds
- Canadian government bonds
- UK gilts
- Australian government bonds
Bonds are considered safer than stocks because:
- Income is more predictable
- Prices fluctuate less
- Governments are less likely to default
However, bonds usually produce lower returns than stocks over long periods.
Why Combine Stocks and Bonds?
The entire purpose of the 60/40 portfolio is balance.
Stocks provide:
- Long-term growth
- Inflation protection
- Higher returns
Bonds provide:
- Stability
- Income
- Lower volatility
- Protection during recessions
Historically, when stocks performed poorly, bonds often performed better.
This negative or low correlation helped reduce overall portfolio risk.
Understanding Correlation
Correlation measures how investments move relative to each other.
| Correlation | Meaning |
|---|---|
| +1 | Move together perfectly |
| 0 | No relationship |
| -1 | Move opposite each other |
Historically:
- Stocks and bonds often had low or negative correlation.
This means:
- When stocks fell, bonds sometimes rose.
That reduced overall portfolio losses.
Historical Origins of the 60/40 Portfolio
The strategy became popular in the late 20th century among:
- Pension funds
- Retirement planners
- Wealth managers
Financial advisors realized that:
- 100% stock portfolios created large emotional stress
- Conservative bond-only portfolios often failed to beat inflation
The 60/40 mix became a middle ground.
It aimed to:
- Preserve wealth
- Grow capital
- Reduce volatility
The Mathematics Behind the 60/40 Portfolio
The portfolio works because of diversification.
Diversification means spreading risk across multiple assets.
The expected portfolio return can be estimated as:
R_p = (0.6 \times R_s) + (0.4 \times R_b)
Where:
- (R_p) = Portfolio return
- (R_s) = Stock return
- (R_b) = Bond return
Example:
If:
- Stocks return 10%
- Bonds return 4%
Then:
[
(0.6 \times 10%) + (0.4 \times 4%)
]
[
6% + 1.6% = 7.6%
]
Expected portfolio return:
7.6%
Historical Performance of the 60/40 Portfolio
Historically, the 60/40 strategy performed surprisingly well.
Approximate historical annual returns:
| Portfolio Type | Historical Average Return |
|---|---|
| 100% Stocks | 9%–10% |
| 60/40 Portfolio | 7%–8% |
| 100% Bonds | 4%–5% |
The key benefit:
- Lower volatility than all-stock portfolios.
Example: The 2008 Financial Crisis
During the 2008 global financial crisis:
Stocks crashed heavily.
The U.S. stock market lost more than 35%.
However:
Government bonds performed relatively well.
A diversified 60/40 portfolio lost far less than an all-stock portfolio.
Example:
| Portfolio | Approximate Loss |
|---|---|
| 100% Stocks | -37% |
| 60/40 Portfolio | -20% to -25% |
This demonstrated the defensive role of bonds.
Example: COVID-19 Market Crash (2020)
In March 2020:
Global stock markets fell rapidly.
But central banks lowered interest rates aggressively.
Bond prices increased.
Again, bonds helped cushion losses in diversified portfolios.
When the 60/40 Portfolio Struggles
The strategy does not always work perfectly.
One major challenge occurs during:
- High inflation
- Rising interest rates
In these periods:
- Stocks may decline
- Bonds may also decline
This happened significantly in 2022.
Why Bonds Fell in 2022
Bond prices move inversely to interest rates.
This relationship can be visualized as:
P \propto \frac{1}{r}
Where:
- (P) = Bond price
- (r) = Interest rate
When interest rates rise:
- Existing bond prices fall.
In 2022:
- Central banks rapidly increased interest rates to fight inflation.
- Stocks fell.
- Bonds also fell.
This hurt traditional 60/40 portfolios.
Does the 60/40 Portfolio Still Work?
This is one of the biggest debates in investing today.
Some experts believe:
- The strategy still works over long periods.
Others argue:
- Modern markets require more diversification.
The truth is nuanced.
The 60/40 portfolio still offers:
- Simplicity
- Diversification
- Lower risk than all-stock investing
But investors may need adjustments depending on:
- Age
- Goals
- Inflation environment
- Interest rates
- Risk tolerance
Advantages of the 60/40 Portfolio
1. Simplicity
The strategy is easy to understand.
You only need:
- Stock investments
- Bond investments
No complicated trading is required.
2. Diversification
Diversification reduces concentration risk.
Instead of relying entirely on stocks, bonds help stabilize returns.
3. Lower Volatility
Volatility means large swings in portfolio value.
The 60/40 portfolio historically reduced emotional stress during market crashes.
4. Better for Retirees
Retirees often cannot tolerate massive stock market declines.
The bond allocation provides:
- Income
- Stability
- Capital preservation
5. Rebalancing Opportunities
Rebalancing means restoring target allocations.
Example:
Suppose:
- Stocks rise sharply.
- Portfolio becomes 70/30.
You can:
- Sell some stocks
- Buy more bonds
This enforces disciplined investing.
What Is Rebalancing?
Rebalancing restores the original asset allocation.
Example:
Starting allocation:
| Asset | Allocation |
|---|---|
| Stocks | 60% |
| Bonds | 40% |
After a bull market:
| Asset | New Allocation |
|---|---|
| Stocks | 75% |
| Bonds | 25% |
You rebalance by:
- Selling stocks
- Buying bonds
This helps maintain risk levels.
Rebalancing Example
Emma invests:
- $60,000 in stocks
- $40,000 in bonds
Total:
$100,000
After one year:
| Asset | Value |
|---|---|
| Stocks | $78,000 |
| Bonds | $42,000 |
Total:
$120,000
New allocation:
| Asset | Percentage |
|---|---|
| Stocks | 65% |
| Bonds | 35% |
To rebalance:
- Sell some stocks
- Buy bonds
- Restore 60/40
Disadvantages of the 60/40 Portfolio
1. Lower Long-Term Returns
Compared with 100% stocks, the portfolio usually grows more slowly.
Young investors may sacrifice long-term growth.
2. Inflation Risk
Inflation reduces purchasing power.
Bonds can struggle during high inflation periods.
Inflation Explained
Inflation means prices rise over time.
Example:
A basket of groceries costing:
- $100 today
- May cost $120 in the future
If investments grow slower than inflation:
- Real wealth declines.
Real Return vs Nominal Return
This distinction is extremely important.
Nominal Return
The stated investment return before inflation.
Real Return
Return after inflation.
The relationship is approximately:
\text{Real Return} \approx \text{Nominal Return} – \text{Inflation Rate}
Example:
- Portfolio return = 8%
- Inflation = 3%
Real return ≈ 5%
3. Interest Rate Risk
Bond prices can decline when interest rates rise.
Long-term bonds are especially sensitive.
4. Sequence of Returns Risk
This is critical for retirees.
Sequence risk means:
Poor returns early in retirement can permanently damage a portfolio.
Example:
Two retirees average the same return over 20 years.
But:
- One experiences crashes early.
- The other experiences crashes later.
The first retiree may run out of money sooner.
Case Study: Young Investor
Scenario
David is 28 years old in Canada.
He plans to retire in 35 years.
He chooses:
- 60% global stock ETFs
- 40% bond ETFs
Benefits
- Lower volatility
- Easier emotionally
- Less panic during crashes
Drawbacks
Over 35 years:
- A higher stock allocation may outperform significantly.
For young investors:
- 80/20 or 90/10 portfolios are often considered more growth-oriented.
Case Study: Retiree
Scenario
Linda is 67 years old in the United Kingdom.
She depends on investment income.
She uses:
- 60% dividend-paying stock funds
- 40% government bonds
Why It Works
- Bonds reduce volatility.
- Income becomes more predictable.
- Portfolio drawdowns are smaller.
This is closer to the original purpose of the strategy.
Case Study: 2022 Inflation Shock
Michael from Australia used a classic 60/40 portfolio.
In 2022:
- Stocks declined
- Bonds declined
- Inflation surged
His portfolio lost more than expected.
Lesson:
- Diversification helps, but no strategy eliminates risk entirely.
The Psychology Behind the 60/40 Portfolio
Investment success is not only mathematical.
Psychology matters enormously.
Many investors panic during crashes.
A 100% stock portfolio may be difficult emotionally.
If investors sell during market crashes:
- Long-term returns suffer badly.
The 60/40 strategy aims to reduce panic and emotional mistakes.
Behavioral Finance and Emotional Investing
Behavioral finance studies how emotions affect investment decisions.
Common mistakes include:
| Mistake | Description |
|---|---|
| Panic Selling | Selling during crashes |
| FOMO | Fear of missing out |
| Overconfidence | Taking excessive risk |
| Recency Bias | Assuming recent trends continue forever |
Balanced portfolios may help investors stay disciplined.
Modern Variations of the 60/40 Portfolio
Many investors now modify the traditional model.
Examples include:
| Portfolio | Allocation |
|---|---|
| 70/30 | More aggressive |
| 80/20 | Higher growth |
| 50/50 | More conservative |
| 40/60 | Retirement-focused |
Global Diversification
Modern portfolios often include international investments.
Examples:
- U.S. stocks
- European stocks
- Emerging markets
- International bonds
Global diversification reduces country-specific risk.
ETFs and the 60/40 Portfolio
Most modern investors build 60/40 portfolios using ETFs.
ETF means:
Exchange-Traded Fund.
ETFs offer:
- Low fees
- Diversification
- Easy trading
- Tax efficiency
Popular providers include:
Example ETF-Based 60/40 Portfolio
U.S. Example
Stock Portion (60%)
- Total U.S. Stock Market ETF
- International Stock ETF
Bond Portion (40%)
- U.S. Treasury Bond ETF
- Aggregate Bond ETF
Tax Considerations in Tier-1 Countries
Taxes significantly affect investment returns.
United States
Common retirement accounts include:
- 401(k)
- Traditional IRA
- Roth IRA
Tax advantages:
- Tax deferral
- Tax-free growth (Roth)
Canada
Popular accounts include:
- TFSA
- RRSP
The TFSA is especially powerful because investment gains may be tax-free.
United Kingdom
Popular accounts:
- ISA
- SIPP
ISAs provide tax-free investing benefits.
Australia
Common retirement system:
- Superannuation
Super accounts offer tax advantages for retirement investing.
How Inflation Changes Portfolio Design
During high inflation periods:
Traditional bonds may struggle.
Some investors add:
- Commodities
- Real estate
- Inflation-protected securities
Examples include:
- TIPS in the United States
What Are TIPS?
TIPS stands for:
Treasury Inflation-Protected Securities.
These are U.S. government bonds adjusted for inflation.
They help protect purchasing power.
Should You Use a 60/40 Portfolio?
The answer depends on:
| Factor | Importance |
|---|---|
| Age | Younger investors may take more risk |
| Income Stability | Stable income allows higher risk |
| Emotional Tolerance | Some investors panic easily |
| Retirement Timeline | Longer timelines favor stocks |
| Financial Goals | Income vs growth |
Who May Benefit Most?
The 60/40 portfolio may work well for:
- Retirees
- Moderate-risk investors
- Long-term savers
- Investors seeking simplicity
Who Might Prefer Different Allocations?
Aggressive investors may prefer:
- 80/20
- 90/10
- 100% stocks
Conservative investors may prefer:
- 40/60
- 30/70
Example: Comparing Portfolios Over Time
Suppose three investors each invest:
$100,000
For 25 years.
| Portfolio | Average Return |
|---|---|
| 100% Stocks | 10% |
| 60/40 | 7.5% |
| 100% Bonds | 4% |
Approximate ending values:
| Portfolio | Final Value |
|---|---|
| 100% Stocks | ~$1.08 million |
| 60/40 | ~$610,000 |
| 100% Bonds | ~$266,000 |
This shows:
- Stocks create more long-term wealth.
- Bonds reduce volatility but lower growth.
Compound Growth and the 60/40 Portfolio
Compounding means earning returns on previous returns.
This is one of the most powerful concepts in finance.
The compound growth formula is:
genui{“math_block_widget_always_prefetch_v2”:{“content”:”FV = PV(1+r)^n”}}
Where:
- (FV) = Future value
- (PV) = Present value
- (r) = Annual return
- (n) = Number of years
Example:
- $100,000 invested
- 7% annual return
- 25 years
Result:
Approximately $543,000+
This demonstrates how long-term investing creates wealth.
Common Mistakes With the 60/40 Portfolio
1. Ignoring Rebalancing
Without rebalancing:
- Risk levels drift over time.
2. Chasing Performance
Investors often switch strategies after crashes.
This usually hurts returns.
3. Taking Too Little Risk
Young investors sometimes become overly conservative.
Too many bonds may reduce future wealth significantly.
4. Ignoring Fees
High management fees reduce long-term returns.
Even a 1% annual fee can cost hundreds of thousands over decades.
The Future of the 60/40 Portfolio
Experts remain divided.
Some believe:
- Rising interest rates make bonds attractive again.
Others argue:
- Traditional diversification is less reliable than before.
Possible future adaptations include:
- Alternative assets
- Real estate exposure
- Commodity exposure
- Inflation hedges
- Global diversification
Practical Example: Building a 60/40 Portfolio
Suppose Jennifer from the U.S. has:
$500,000 to invest.
She allocates:
| Investment Type | Allocation |
|---|---|
| U.S. Stocks | 40% |
| International Stocks | 20% |
| Government Bonds | 25% |
| Corporate Bonds | 15% |
This maintains the overall:
- 60% stocks
- 40% bonds
But adds deeper diversification.
Key Lessons About the 60/40 Portfolio
The 60/40 portfolio is not magical.
It is simply a balanced approach to managing:
- Risk
- Growth
- Stability
Its success historically came from:
- Diversification
- Discipline
- Long-term investing
- Emotional control
The strategy still has value today, especially for:
- Retirement planning
- Moderate-risk investors
- Wealth preservation
However:
- Younger investors may prefer more stocks.
- Inflation can hurt bond performance.
- Modern diversification may require additional asset classes.
Final Thoughts
The 60/40 portfolio remains one of the most influential investment strategies ever created.
Its simplicity makes it appealing:
- 60% growth assets
- 40% stabilizing assets
For decades, this balance helped investors navigate:
- Recessions
- Inflation cycles
- Market crashes
- Economic uncertainty
The biggest lesson is not necessarily the exact allocation itself.
The real lesson is the importance of:
- Diversification
- Discipline
- Rebalancing
- Long-term thinking
- Risk management
No portfolio guarantees profits.
Every investment strategy involves trade-offs between:
- Risk
- Return
- Stability
- Inflation protection
But for many investors in Tier-1 countries, the 60/40 portfolio still provides a practical framework for building long-term financial security.