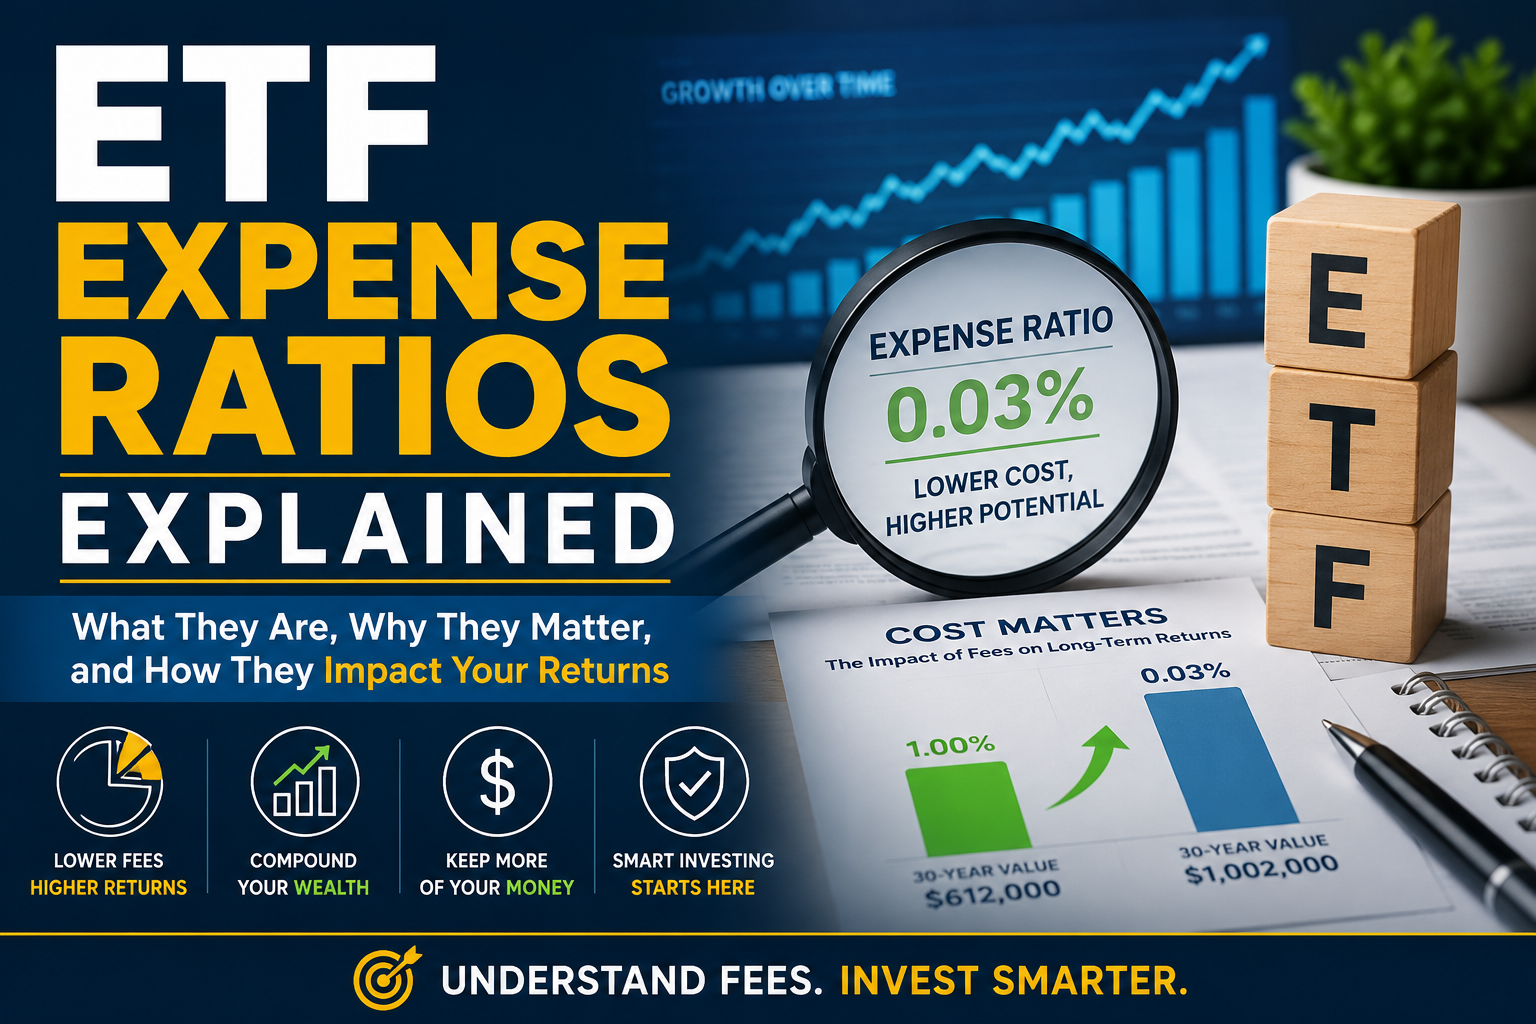
ETF Expense Ratios Explained (2026 Complete Beginner-to-Advanced Guide)
ETF Expense Ratios Explained is one of the most important investing topics every beginner and experienced investor should understand. An ETF expense ratio may seem small, but over decades it can significantly impact portfolio growth, retirement savings, and overall investment returns.
Exchange-Traded Funds (ETFs) have become one of the most powerful investment tools in modern finance. Millions of investors across the United States, Canada, the United Kingdom, Australia, and many other countries use ETFs to build wealth, save for retirement, generate passive income, and diversify their portfolios.
But when investors start comparing ETFs, one term appears everywhere:
“Expense Ratio”
At first glance, the expense ratio looks tiny:
- 0.03%
- 0.07%
- 0.20%
- 0.75%
Many beginners think:
“That’s such a small number. Does it even matter?”
The answer is:
Yes — expense ratios matter enormously over the long term.
A tiny difference in fees can cost investors tens of thousands — sometimes hundreds of thousands — of dollars across decades of investing.
Understanding ETF expense ratios is one of the most important concepts in long-term investing because:
- Fees directly reduce returns
- Fees compound negatively over time
- High fees can destroy wealth silently
- Low-cost investing is one of the biggest advantages individual investors have today
This guide will explain:
- What ETF expense ratios are
- How they work
- Why they matter
- How fees are charged
- Hidden ETF costs
- Real-world examples
- Case studies
- Low-cost vs high-cost investing
- Index ETF fees vs active ETF fees
- International ETF fees
- Bond ETF fees
- Smart beta ETF fees
- How to evaluate ETF costs like a professional investor
By the end, you’ll understand ETF expense ratios from beginner to advanced level.
What Is an ETF?
An ETF (Exchange-Traded Fund) is an investment fund that trades on a stock exchange like an individual stock.
An ETF can contain:
- Stocks
- Bonds
- Commodities
- Real estate assets
- International securities
- Dividend companies
- Technology companies
- Entire market indexes
Instead of buying one stock, investors buy a basket of investments through a single ETF.
For example:
An S&P 500 ETF may own shares of approximately 500 large U.S. companies.
That means when you buy one ETF share, you instantly gain diversification across many businesses.
Popular ETF providers include:
- Vanguard
- BlackRock (through iShares ETFs)
- State Street Global Advisors
- Fidelity Investments
- Charles Schwab Corporation
What Is an ETF Expense Ratio?
The expense ratio is the annual fee charged by an ETF provider to manage and operate the fund.
It is expressed as a percentage of your investment.
For example:
If an ETF has an expense ratio of:
- 0.03%
- And you invest $10,000
Then annual fund expenses are approximately:
$10,000 × 0.03% = $3 per year
That sounds tiny.
But over decades, fees compound and significantly impact wealth.
Simple Definition
ETF Expense Ratio = Annual Operating Cost of the Fund
The fee covers:
- Fund management
- Administrative costs
- Portfolio maintenance
- Legal expenses
- Custodian fees
- Marketing
- Accounting
- Index licensing fees
The fee is automatically deducted from the ETF’s assets.
You do NOT receive a separate bill.
Understanding the Word “Expense Ratio”
Let’s break down the term.
Expense
“Expense” means cost.
The ETF company spends money operating the fund.
Ratio
“Ratio” means percentage relative to total assets.
So:
Expense Ratio = Operating Expenses ÷ Total Fund Assets
Example of Expense Ratio Calculation
Suppose an ETF manages:
$10 billion in assets
Annual operating costs:
$5 million
Expense ratio:
$5 million ÷ $10 billion = 0.05%
That becomes the ETF’s expense ratio.
Why ETF Expense Ratios Matter
Expense ratios directly reduce investor returns.
This is critical.
If the market returns:
10%
And ETF expenses are:
1%
Then your approximate return becomes:
9%
That may not seem huge in one year.
But over 30 years?
The difference becomes enormous.
The Power of Compounding Fees
Investors understand compound growth.
But many forget:
Fees compound negatively.
Every dollar lost to fees:
- Stops compounding
- Stops earning future returns
- Permanently reduces wealth
This creates a massive long-term impact.
Case Study: Low Fees vs High Fees
Let’s compare two investors.
Investor A
- Invests $500/month
- ETF fee: 0.03%
- Annual return before fees: 8%
- Time horizon: 30 years
Investor B
- Same investment
- ETF fee: 1.00%
- Same market performance
Results
Investor A (0.03% fee)
Approximate portfolio value:
$744,000+
Investor B (1.00% fee)
Approximate portfolio value:
$620,000+
Difference
Investor B loses over:
$120,000+
…mostly due to higher fees.
This is why legendary investor Warren Buffett consistently recommends low-cost index investing.
How ETF Fees Are Actually Charged
Many beginners think ETF companies deduct money from their brokerage account directly.
That’s not how it works.
ETF fees are usually deducted internally from fund assets.
This happens automatically.
You typically won’t see:
- Monthly invoices
- Bills
- Fee withdrawal notifications
Instead:
The ETF’s Net Asset Value (NAV) slowly reflects the expenses.
What Is NAV?
NAV stands for:
Net Asset Value
It represents the total value of ETF assets minus liabilities divided by outstanding shares.
Expense ratios reduce NAV slightly each day.
Are Expense Ratios Charged Daily?
Yes.
Most ETFs accrue expenses daily.
Example:
0.12% annual expense ratio
Daily deduction approximately equals:
0.12% ÷ 365
This tiny deduction happens continuously inside the fund.
Average ETF Expense Ratios
Expense ratios vary widely.
Ultra-Low-Cost Index ETFs
Typical range:
- 0.03%
- 0.04%
- 0.05%
Examples include broad market ETFs from:
- Vanguard
- BlackRock
- Charles Schwab Corporation
Sector ETFs
Typical range:
- 0.10%–0.50%
These focus on:
- Technology
- Healthcare
- Energy
- AI
- Semiconductors
International ETFs
Typical range:
- 0.07%–0.60%
International investing often costs more because of:
- Foreign market access
- Currency management
- Trading costs
- Regulatory complexity
Bond ETFs
Typical range:
- 0.03%–0.50%
Government bond ETFs are usually cheaper than corporate or emerging-market bond ETFs.
Active ETFs
Typical range:
- 0.50%–1.50%
Active ETFs involve human portfolio managers trying to outperform the market.
Higher research and trading costs lead to higher expense ratios.
What Is a Low Expense Ratio?
Generally:
| Expense Ratio | Interpretation |
|---|---|
| 0.00%–0.10% | Extremely low |
| 0.10%–0.25% | Low |
| 0.25%–0.50% | Moderate |
| 0.50%–1.00% | High |
| Above 1.00% | Very high |
Why Index ETFs Usually Have Lower Fees
Index ETFs simply track an index.
Example indexes:
- S&P 500
- Nasdaq-100
- Total Stock Market
- MSCI World
Since the ETF only follows a predefined index:
- Less research required
- Fewer analysts needed
- Less trading activity
- Lower management costs
That allows providers to offer extremely low fees.
What Is Passive Investing?
Passive investing means:
Trying to match market performance rather than beat it.
Most index ETFs are passive investments.
Passive investing became extremely popular after research showed:
Most active managers fail to beat the market long term.
Active ETFs vs Passive ETFs
Active ETF
Human managers make investment decisions.
Goal:
Beat the market.
Advantages
- Potential outperformance
- Tactical flexibility
Disadvantages
- Higher fees
- More trading
- Often underperform indexes after fees
Passive ETF
Tracks an index automatically.
Advantages
- Very low fees
- Broad diversification
- Tax efficiency
- Historically strong long-term results
Disadvantages
- Will not outperform the index
- Follows market downturns
Case Study: Active vs Passive ETF
Suppose:
Active ETF
- Return before fees: 10%
- Expense ratio: 1.2%
Net return:
8.8%
Passive ETF
- Market return: 9%
- Expense ratio: 0.03%
Net return:
8.97%
Despite lower gross returns, the passive ETF can outperform after fees.
Expense Ratio vs Trading Costs
Expense ratio is NOT the only ETF cost.
Investors should also understand:
Trading Costs
These include:
- Bid-ask spreads
- Brokerage commissions
- Market impact
What Is the Bid-Ask Spread?
Every ETF has:
- Bid price = highest buyer offer
- Ask price = lowest seller offer
The difference is the spread.
Example:
- Bid = $100.00
- Ask = $100.05
Spread = $0.05
This acts like an indirect trading cost.
Why ETF Liquidity Matters
Highly liquid ETFs usually have:
- Smaller spreads
- Better pricing
- Lower hidden costs
Large ETFs from major providers often trade efficiently.
Hidden ETF Costs Investors Ignore
Many investors focus only on expense ratios.
But ETFs may include additional hidden costs.
1. Tracking Error
Tracking error measures how closely an ETF follows its benchmark index.
If an ETF underperforms its index consistently, hidden costs may exist.
Reasons include:
- Trading friction
- Cash drag
- Rebalancing costs
- Taxes
- Poor management efficiency
Example of Tracking Error
Suppose:
S&P 500 returns:
10%
ETF returns:
9.6%
Expense ratio:
0.03%
Why missing 0.37%?
Potential reasons:
- Trading costs
- Cash holdings
- Sampling methods
2. Turnover Costs
Turnover means buying and selling securities inside the ETF.
High turnover creates:
- Transaction costs
- Tax inefficiencies
- Slippage
Actively managed ETFs usually have higher turnover.
3. Currency Hedging Costs
International ETFs may hedge currencies.
Currency hedging protects against exchange-rate fluctuations.
But hedging costs money.
This can increase effective ETF expenses.
4. Securities Lending Risks
Some ETFs lend securities to generate additional income.
This can reduce expenses slightly.
But it introduces counterparty risk.
Most major ETF providers manage this carefully.
Zero-Fee ETFs: Are They Really Free?
Some investment firms launched “zero expense ratio” funds.
This sounds amazing.
But investors should ask:
How does the company make money?
Possible answers:
- Securities lending revenue
- Cross-selling financial products
- Cash management profits
- Ecosystem retention strategy
Zero-fee funds may still involve indirect costs.
Expense Ratios and Retirement Investing
Expense ratios become especially important in retirement accounts because:
- Investments compound for decades
- Fees accumulate continuously
- Retirement portfolios become very large
Case Study: Retirement Impact
Suppose:
- Starting age: 25
- Retirement age: 65
- Monthly investment: $600
- Return before fees: 8%
ETF A
Expense ratio: 0.04%
Final value:
Approximately $1.87 million
ETF B
Expense ratio: 1%
Final value:
Approximately $1.43 million
Difference
Over:
$400,000 lost to fees
This demonstrates why low-cost investing is powerful.
Why Large Institutions Prefer Low Fees
Major pension funds and institutional investors care deeply about costs.
Why?
Because even tiny fee reductions save millions.
For example:
A pension fund managing:
$50 billion
Reducing fees by:
0.50%
Could save:
$250 million annually
That’s enormous.
ETF Fee Wars
The ETF industry has experienced intense competition called:
“The Fee War”
Major firms continuously lower fees to attract investors.
This has benefited ordinary investors tremendously.
Companies competing aggressively include:
- Vanguard
- BlackRock
- Fidelity Investments
- Charles Schwab Corporation
Many broad-market ETFs now cost almost nothing.
Why Some ETFs Have High Expense Ratios
Not all expensive ETFs are bad.
Some strategies genuinely cost more to operate.
Examples:
- Emerging markets
- Leveraged ETFs
- AI-focused thematic ETFs
- Active bond strategies
- Commodity ETFs
Higher fees may reflect:
- Complex management
- Derivatives usage
- Specialized research
- Lower trading liquidity
Leveraged ETFs and Expense Ratios
Leveraged ETFs attempt to multiply market returns.
Examples:
- 2× daily returns
- 3× daily returns
These ETFs often have:
- High expense ratios
- Higher volatility
- Derivative costs
- Compounding risks
They are generally designed for short-term trading rather than long-term investing.
Smart Beta ETFs
Smart beta ETFs combine:
- Passive investing
- Rules-based strategy tilts
Examples:
- Value investing
- Momentum
- Quality factor
- Low volatility
- Dividend growth
These ETFs usually cost more than basic index ETFs but less than active funds.
ESG ETFs and Fees
ESG stands for:
Environmental, Social, and Governance
ESG ETFs select companies based on sustainability criteria.
These funds may charge slightly higher expense ratios because:
- ESG screening requires research
- Index construction is more specialized
Cryptocurrency ETFs and Fees
Crypto ETFs often have higher expense ratios due to:
- Custody complexity
- Regulatory costs
- Security infrastructure
- Volatility management
Bitcoin ETFs may charge significantly more than standard stock ETFs.
Examples involve firms like:
- BlackRock
- Grayscale Investments
Bond ETF Expense Ratios
Bond ETFs are usually low-cost, but complexity matters.
Treasury Bond ETFs
Often very cheap because:
- High liquidity
- Simple portfolios
Corporate Bond ETFs
More expensive because:
- Credit analysis required
- Less liquid markets
- Trading complexity
Emerging Market Bond ETFs
Usually more expensive due to:
- Currency risk
- Political risk
- Trading costs
- Lower liquidity
International ETF Expense Ratios
International investing can involve additional expenses:
- Foreign taxes
- Currency conversion
- Custody arrangements
- International compliance
- Settlement systems
This is why international ETFs are often slightly more expensive than domestic broad-market ETFs.
ETF Expense Ratio vs Mutual Fund Expense Ratio
Historically:
ETFs usually had lower fees than mutual funds.
Why?
Because ETFs are often:
- Passively managed
- More tax-efficient
- Operationally efficient
However, low-cost index mutual funds now also offer competitive pricing.
Tax Efficiency and ETF Costs
ETFs are generally more tax-efficient than mutual funds due to:
In-Kind Creation and Redemption
This mechanism reduces taxable capital gains distributions.
Lower taxes can improve after-tax returns significantly.
How to Find an ETF’s Expense Ratio
Investors can find expense ratios through:
- ETF provider websites
- Brokerage platforms
- Fund prospectuses
- Financial news websites
Common sections include:
- “Fees”
- “Fund expenses”
- “Expense ratio”
- “Net expense ratio”
Gross Expense Ratio vs Net Expense Ratio
Some ETFs display two numbers:
Gross Expense Ratio
Total fees before waivers.
Net Expense Ratio
Actual current fees after discounts or reimbursements.
Temporary fee waivers may expire later.
Investors should read carefully.
Why Expense Ratios Keep Falling
Several forces drive lower fees:
- Competition
- Technology
- Automation
- Scale economies
- Investor awareness
Large ETF firms manage trillions of dollars.
Huge scale allows extremely low operating costs.
Scale Advantage in ETFs
Suppose:
An ETF manages:
$1 trillion
Even a tiny fee:
0.03%
Generates:
$300 million annually
That can still be enormously profitable for providers.
Can the Cheapest ETF Still Be Bad?
Yes.
Low fees alone do NOT guarantee quality.
Investors should also evaluate:
- Tracking accuracy
- Liquidity
- Fund structure
- Assets under management
- Provider reputation
- Tax efficiency
Case Study: Cheap but Inefficient ETF
Suppose:
ETF expense ratio:
0.02%
But:
- Large bid-ask spreads
- Poor liquidity
- Significant tracking error
The actual investor cost may exceed a more expensive but efficient ETF.
ETF Assets Under Management (AUM)
AUM means:
Assets Under Management
Large ETFs often provide advantages:
- Better liquidity
- Lower spreads
- Operational stability
- Reduced closure risk
Tiny ETFs sometimes close due to insufficient investor interest.
ETF Closure Risk
Small ETFs with low assets may shut down.
When this happens:
- Shares are liquidated
- Investors receive cash
- Possible taxable events occur
Large established ETFs usually carry lower closure risk.
Expense Ratios and Long-Term Wealth
One of the greatest discoveries in investing is:
Investors cannot control markets, but they can control costs.
This idea transformed modern investing.
Lower fees improve:
- Net returns
- Retirement outcomes
- Wealth accumulation
- Financial independence probability
The Rise of Low-Cost Investing
The low-cost investing revolution was heavily influenced by:
John C. Bogle
He pioneered low-cost index investing and emphasized minimizing fees.
His philosophy:
“In investing, you get what you don’t pay for.”
Meaning:
Lower fees allow investors to keep more returns.
Common ETF Expense Ratio Mistakes
1. Ignoring Fees Completely
Many beginners never check expense ratios.
2. Chasing Trendy ETFs
Hot thematic ETFs may charge excessive fees.
3. Confusing Performance With Skill
High-fee funds sometimes outperform temporarily due to market cycles.
4. Focusing Only on Expense Ratio
Hidden costs matter too.
5. Overtrading ETFs
Frequent buying and selling increases costs regardless of low expense ratios.
How to Evaluate ETF Costs Properly
Professional investors evaluate:
1. Expense Ratio
Direct management fee.
2. Tracking Error
How closely ETF follows benchmark.
3. Liquidity
Trading efficiency.
4. Bid-Ask Spread
Indirect trading cost.
5. Tax Efficiency
After-tax return impact.
6. Fund Size
Operational stability.
Real-World Example: S&P 500 ETFs
Several S&P 500 ETFs exist.
They may appear nearly identical.
But differences include:
- Expense ratio
- Liquidity
- Spread
- Tax efficiency
- Securities lending
- Structure
Major providers compete aggressively in this category.
Is Paying Higher ETF Fees Ever Worth It?
Sometimes.
Examples include:
- Unique investment exposure
- Specialized strategies
- Hard-to-access markets
- Active management with proven process
However:
Investors should demand strong justification for high fees.
Psychological Impact of Fees
High fees often go unnoticed because they are invisible.
This creates a behavioral problem.
People react emotionally to:
- Market crashes
- Stock volatility
But ignore:
- Silent wealth erosion from fees
Yet fees are guaranteed losses.
The Mathematics of Fees
Here’s a simple truth:
If two funds produce identical gross returns:
The lower-cost fund wins.
Over long periods, even tiny fee differences matter enormously.
Example of Fee Difference Over 40 Years
Initial investment:
$100,000
Annual return before fees:
8%
Fund A
Expense ratio:
0.05%
Ending value:
Approximately $2.14 million
Fund B
Expense ratio:
1.00%
Ending value:
Approximately $1.49 million
Difference
Over:
$650,000 lost to fees
That is the power of compounding costs.
ETF Expense Ratios in Different Countries
Expense ratios vary globally.
United States
Often lowest fees due to massive competition and scale.
Canada
Generally slightly higher fees.
Europe
UCITS ETFs vary widely in cost.
Australia
ETF competition increasing rapidly.
Emerging Markets
Higher operational complexity often means higher fees.
Future of ETF Fees
Many analysts believe:
Basic index ETF fees may approach zero permanently.
Future competition may focus on:
- Platform ecosystems
- Financial advice
- Premium services
- Specialized strategies
Final Thoughts
ETF expense ratios may appear small, but they are one of the most important factors in long-term investing success.
A difference of:
- 0.05%
vs - 1.00%
Can translate into hundreds of thousands of dollars across decades.
The most successful long-term investors often focus on:
- Diversification
- Discipline
- Long-term compounding
- Tax efficiency
- Low costs
Expense ratios are one of the few investment variables investors can directly control.
Understanding them properly can dramatically improve wealth-building outcomes over a lifetime.
For most long-term investors, especially retirement savers, minimizing unnecessary costs is one of the smartest financial decisions possible.
3-Fund Portfolio Strategy: Simple Proven Way to Build $1M Wealth (2026 Guide)
Index Funds vs ETFs: Which Is Better for Long-Term Investors? (2026 Guide)