Introduction: Why ETF Expense Ratios Explained Matters for Long-Term Investors
ETF Expense Ratios Explained is an essential investing topic for anyone who wants to build long-term wealth through exchange-traded funds (ETFs). When investors compare funds, they often examine historical performance, portfolio holdings, dividend yields, and risk levels. However, one important factor is sometimes overlooked: the expense ratio.
An expense ratio represents the annual operating expenses of an investment fund as a percentage of its average net assets. Although the percentage may appear insignificant, its effect can become substantial when an investment compounds over 10, 20, or 30 years.
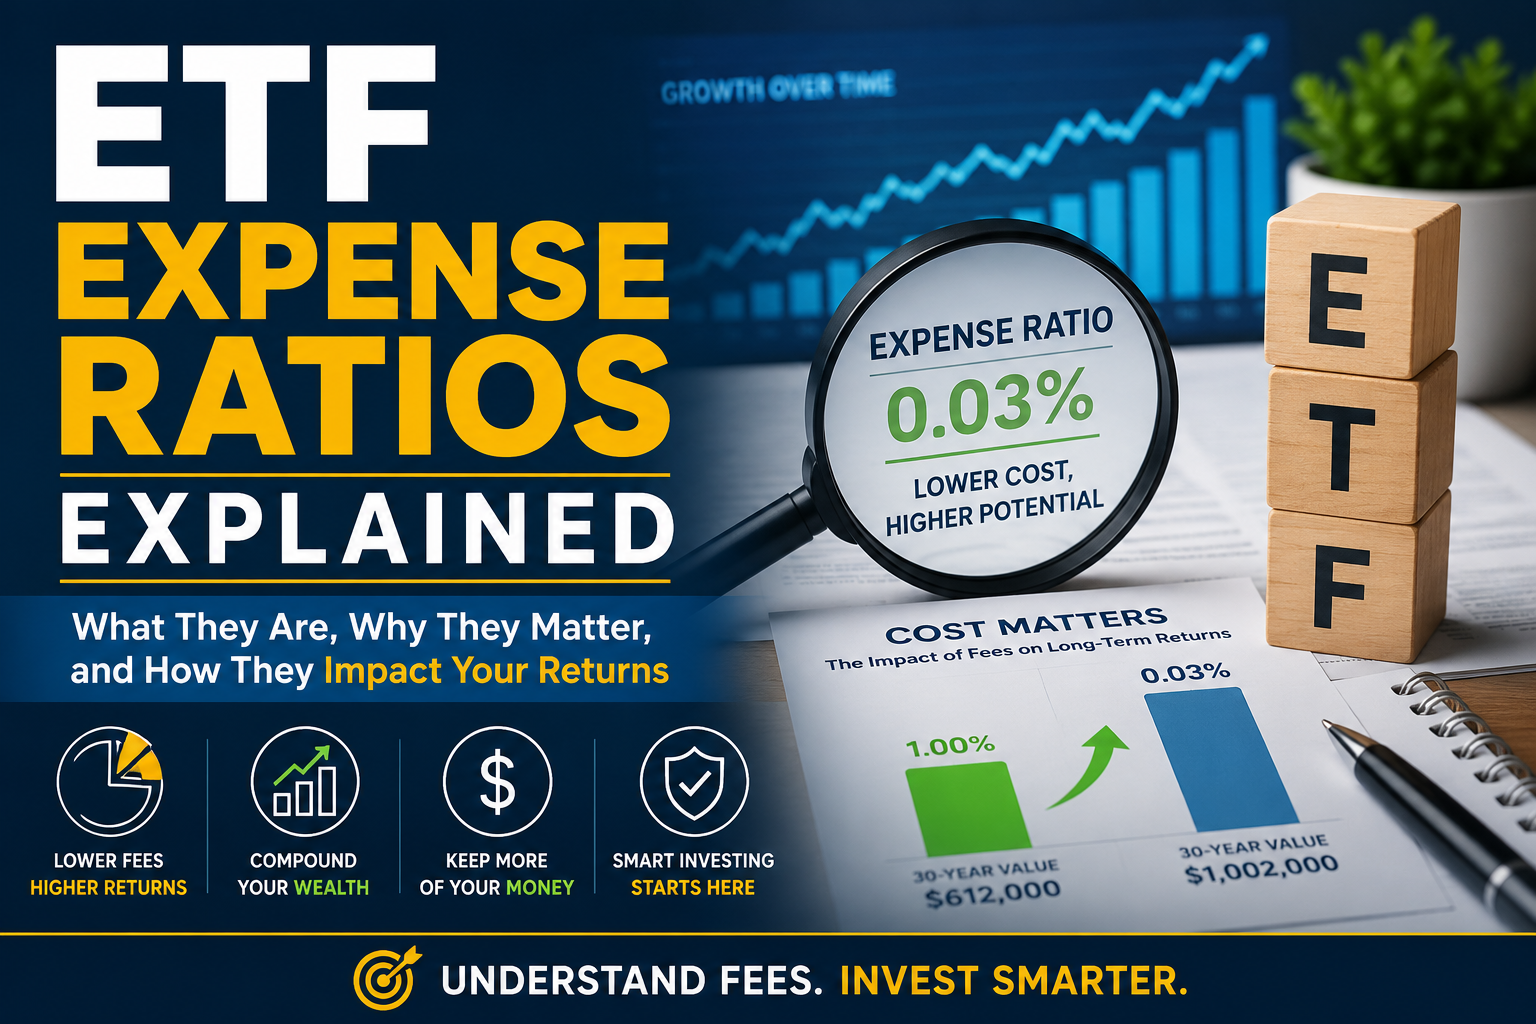
Consider two investors who each invest $10,000 in similar ETFs. One chooses a fund charging 0.03% annually, while the other selects a fund charging 1.00%. If both funds earn identical returns before expenses, the lower-cost fund leaves more money invested and available for future growth.
This difference becomes especially important for retirement accounts, long-term portfolios, and investors who regularly contribute money.
In this comprehensive guide, we will explain ETF expense ratios from beginner to advanced levels, including their formulas, calculations, actual fund examples, historical industry developments, case studies, hidden costs, and practical evaluation methods.
You will also learn why the cheapest ETF is not automatically the best ETF and how to compare total investment costs before making a decision.
What Is an ETF Expense Ratio?
An ETF expense ratio is the annual operating cost charged by an exchange-traded fund (ETF) provider to manage and operate the fund. It is expressed as a percentage of the fund’s average net assets. For additional information about how exchange-traded funds operate, their investment structures, and associated costs, investors can consult the SEC’s Investor.gov guide to mutual funds and exchange-traded funds.
In simple terms, it tells investors how much of their investment is used to cover the fund’s operating expenses.
For example, suppose you invest $10,000 in an ETF with an annual expense ratio of 0.10%.
Your approximate annual fund expense would be $10.
If the expense ratio is 1.00%, the approximate annual expense would be $100 on the same investment value.
Understanding the term ETF
ETF stands for Exchange-Traded Fund.
- Exchange: A regulated marketplace where securities are bought and sold.
- Traded: Means investors can purchase and sell ETF shares during exchange trading hours.
- Fund: A pooled investment vehicle that holds assets such as stocks, bonds, commodities, or other securities.
For example, An S&P 500 ETF provides exposure to companies included in the stock market through companies included in the S&P 500 Index without requiring an investor to purchase every constituent stock individually.
Understanding the term expense
An expense is the money required to operate an investment fund.
An ETF provider incurs expenses for portfolio administration, accounting, regulatory compliance, custody, index licensing, and other permitted operating activities.
Understanding the term ratio
A ratio expresses the relationship between two quantities.
In this case, the expense ratio compares a fund’s annual operating expenses with its average net assets.
ETF Expense Ratio Formula
Expense Ratio (%) = (Annual Operating Expenses ÷ Average Net Assets) × 100
Example:
Suppose an ETF has:
- Annual operating expenses: $5 million
- Average net assets: $10 billion
Expense Ratio = ($5,000,000 ÷ $10,000,000,000) × 100
Expense Ratio = 0.0005 × 100
Expense Ratio = 0.05%
Therefore, the ETF’s expense ratio is 0.05%.
This means the fund incurs approximately $5 in annual operating expenses for every $10,000 invested, assuming the investment value remains constant.
What Does an ETF Expense Ratio Include?
An ETF’s expense ratio generally covers the fund’s operating expenses. However, the exact expenses depend on its investment structure, management approach, and prospectus.
Understanding these individual costs helps investors evaluate what they are paying for.
3.1 Investment Management Fees
Investment management fees compensate the fund manager for managing the ETF’s portfolio.
For an actively managed ETF, portfolio managers may research companies, evaluate financial statements, monitor economic conditions, and decide which securities to buy or sell.
Passive ETFs generally follow an index or predefined investment strategy, which can require less discretionary management.
3.2 Administrative Expenses
Administrative expenses cover the everyday operation of the fund.
Examples include:
- Fund accounting
- Financial reporting
- Recordkeeping
- Shareholder communications
- Regulatory administration
These activities help ensure the ETF operates according to its governing documents and applicable regulations.
3.3 Custodian Fees
A custodian is a financial institution responsible for safekeeping fund assets and maintaining related records.
For example, an ETF holding hundreds of stocks needs arrangements to safeguard securities and process transactions.
3.4 Legal and Regulatory Expenses
ETFs must comply with applicable securities laws, disclosure requirements, reporting obligations, and other regulations.
Legal and compliance expenses support these responsibilities.
3.5 Index Licensing Fees
Some passive ETFs track third-party indexes.
An index provider may charge the ETF issuer for permission to use its index methodology, data, or intellectual property.
For example, an ETF tracking the S&P 500 may incur index-related licensing expenses under its commercial arrangements.
3.6 Marketing and Distribution Expenses
Certain fund structures include distribution or marketing expenses.
In the United States, some mutual funds and ETFs may have Rule 12b-1 fees where applicable. Investors should check the fund’s fee table rather than assume every ETF charges such expenses.
Important: Not every expense incurred by an ETF is necessarily included in its stated expense ratio. Brokerage commissions, bid-ask spreads, certain transaction costs, and investors’ taxes can be additional costs.
How Are ETF Expense Ratios Charged?
One of the most common beginner questions is whether ETF companies directly withdraw management fees from an investor’s brokerage account.
Generally, they do not.
ETF operating expenses are paid from the fund’s assets. These expenses reduce the fund’s net assets and therefore affect the value of investors’ holdings.
For example:
Suppose you own $20,000 worth of an ETF with an expense ratio of 0.20%.
Formula:
Annual Fund Expense = Investment Value × (Expense Ratio ÷ 100)
Calculation:
Annual Fund Expense = $20,000 × (0.20 ÷ 100)
Annual Fund Expense = $20,000 × 0.002
Annual Fund Expense = $40
The approximate annual expense attributable to your investment is $40, assuming the holding value remains constant.
You generally will not receive a separate $40 bill.
Are ETF Expense Ratios Deducted Daily?
Fund expenses are generally accrued over time, commonly daily, and reflected in the fund’s net asset value (NAV).
A simplified daily expense calculation is:
Daily Expense = (Annual Expense Ratio ÷ 365) × Fund Assets
For a fund with a 0.20% annual expense ratio:
Daily Expense Rate = 0.20% ÷ 365
Daily Expense Rate ≈ 0.0005479%
This represents an approximate daily expense rate, not a separate daily charge to your brokerage account.
For this calculation, the annual expense ratio is expressed as a percentage. Actual fund accounting methods and day-count conventions may vary.
What Is Net Asset Value (NAV)?
NAV stands for Net Asset Value.
It represents the value of a fund’s assets after subtracting its liabilities.
The NAV per share is calculated as:
NAV Per Share = (Total Assets − Total Liabilities) ÷ Outstanding Shares
Example:
An ETF holds:
- Stocks worth $950 million
- Cash worth $50 million
- Liabilities of $10 million
- 10 million outstanding shares
Calculation:
NAV Per Share = ($950 million + $50 million − $10 million) ÷ 10 million
NAV Per Share = $990 million ÷ 10 million
NAV Per Share = $99
Therefore, the ETF’s NAV is $99 per share.
The ETF’s NAV is $99 per share.
ETF shares can trade above or below NAV during market hours. This difference is known as a premium or discount.
An expense ratio reduces fund assets over time, all else being equal, but market movements and other fund activities also affect NAV.
Why ETF Expense Ratios Matter for Long-Term Investors
ETF fees may look insignificant in the short term, but their long-term impact can be substantial.
The reason is compound growth.
Compound growth occurs when investment returns generate additional returns over time.
However, investment expenses reduce the amount of money that remains invested.
Consider two investors:
| Particulars | Investor A | Investor B |
|---|---|---|
| Initial investment | $50,000 | $50,000 |
| Annual return before fees | 8% | 8% |
| Expense ratio | 0.05% | 1.00% |
| Approximate annual return after fees | 7.95% | 7.00% |
| Investment period | 30 years | 30 years |
Using a simplified annual compounding assumption:
FV = P × (1 + r)ⁿ
Where:
- FV = Future Value
- P = Initial investment
- r = Annual return after expenses
- n = Number of years
Investor A:
Initial Investment = $50,000
Annual Return After Expenses = 7.95% = 0.0795
Investment Period = 30 years
FV = $50,000 × (1 + 0.0795)³⁰
FV = $50,000 × (1.0795)³⁰
Investor A’s Future Value ≈ $503,000
Investor B:
Initial Investment = $50,000
Annual Return After Expenses = 7.00% = 0.07
Investment Period = 30 years
FV = $50,000 × (1 + 0.07)³⁰
FV = $50,000 × (1.07)³⁰
Investor B’s Future Value ≈ $380,600
These are illustrative calculations using annual compounding. Actual ETF returns, expenses, and market performance vary.
The lower-cost fund produces a higher projected ending value when both funds earn the same return before expenses.
This demonstrates why ETF expense ratios deserve attention when building long-term portfolios.
Why Do Small Fees Become Large Costs?
Three factors explain the effect:
- Time: Fees are incurred repeatedly throughout the investment period.
- Compounding: Money spent on fees cannot generate future investment returns.
- Investment size: Larger portfolios generally incur larger dollar expenses at the same percentage rate.
Understanding recurring investment costs is an important part of building long-term wealth, particularly when investments remain in the market for several decades. For investors saving for retirement, these factors can make fee differences especially important.
What Is Considered a Good ETF Expense Ratio?
There is no universal expense ratio that makes every ETF good or bad.
A broad-market index ETF may offer a very low fee, while a specialized emerging-market or actively managed ETF may reasonably have a higher operating cost.
The following table provides illustrative categories, not official industry-wide averages.
| Expense ratio | General interpretation |
|---|---|
| 0.00%–0.05% | Very low |
| 0.06%–0.15% | Low |
| 0.16%–0.30% | Relatively low |
| 0.31%–0.50% | Moderate |
| 0.51%–1.00% | Relatively high |
| Above 1.00% | High |
Ultra-Low-Cost Index ETFs
These funds typically track broad indexes and benefit from automated portfolio management and large asset bases.
They can be suitable building blocks for investors seeking diversified market exposure.
Sector ETFs
Sector ETFs concentrate on industries such as:
- Technology
- Healthcare
- Energy
- Financial services
- Consumer goods
Their expenses depend on the index methodology, portfolio complexity, and fund structure.
International ETFs
International ETFs invest outside an investor’s domestic market. Investors should also understand investment diversification because holding investments across different countries, sectors, and asset classes can help manage concentration risk.
They may involve foreign custody arrangements, different trading markets, withholding taxes, and currency-related considerations.
These factors can influence operating costs and overall investment returns.
Bond ETFs
Bond ETFs hold fixed-income securities such as government bonds and corporate bonds.
Some broad government bond funds are inexpensive, while specialized high-yield or emerging-market bond strategies can involve greater research and trading complexity.
Active ETFs
Actively managed ETFs use portfolio managers who make investment decisions rather than simply replicating a benchmark.
Their fees vary widely depending on the strategy and provider.
Real-World ETF Expense Ratio Examples
Examining actual investment products makes expense ratios easier to understand.
The following are established U.S.-listed ETF examples. Their published expense ratios are fund-specific figures, not recommendations. Always verify the latest prospectus and issuer fee page before investing.
7.1 Vanguard S&P 500 ETF (VOO)
The Vanguard S&P 500 ETF (VOO) tracks the S&P 500 Index.
Its published expense ratio is 0.03% OR Expense Ratio = 0.03% = 0.0003.
Suppose an investor holds $100,000 in VOO.
Annual Fund Expense = $100,000 × 0.0003
Annual Fund Expense = $30
The approximate annual expense is $30, assuming the holding value remains constant.
This demonstrates how a low-cost index ETF can provide broad exposure to large U.S. companies at a relatively low operating cost.
7.2 iShares Core S&P 500 ETF (IVV)
The iShares Core S&P 500 ETF (IVV) also tracks the S&P 500 Index.
Its published expense ratio is 0.03%. Investors can verify the fund’s current expense ratio, investment objective, holdings, performance, and other important information through the official iShares Core S&P 500 ETF (IVV) fund page.
An investor holding $100,000 would therefore have an approximate annual fund expense of $30.
VOO and IVV are examples of competing low-cost funds offering exposure to broadly similar market segments.
Investors should compare more than their expense ratios, including tracking difference, liquidity, fund structure, and tax considerations.
7.3 SPDR S&P 500 ETF Trust (SPY)
The SPDR S&P 500 ETF Trust (SPY) is another major S&P 500 ETF.
Its expense ratio has historically been higher than those of VOO and IVV.
SPY has an established history and substantial trading activity, making it particularly relevant when comparing investment holding costs with trading liquidity.
A frequent trader may care greatly about bid-ask spreads and execution quality, while a long-term investor may place greater emphasis on ongoing expenses.
Lesson: A lower expense ratio is attractive, but the correct choice depends on the investor’s strategy, trading frequency, and total cost of ownership.
Case Study: How ETF Fees Affect a 30-Year Investment
Let’s examine a hypothetical long-term investment scenario.
Two investors each contribute $500 every month for 30 years. This regular investment approach is closely related to dollar-cost averaging, a strategy in which investors invest a fixed amount at regular intervals regardless of market conditions.
Both invest in funds with the same assumed 8% annual return before fees.
However, they select different expense ratios.
Investor A: Low-cost ETF
- Monthly contribution: $500
- Annual pre-fee return: 8%
- Expense ratio: 0.03%
- Investment period: 30 years
Investor B: Higher-cost ETF
- Monthly contribution: $500
- Annual pre-fee return: 8%
- Expense ratio: 1.00%
- Investment period: 30 years
For a simplified monthly-contribution model, assume the annual return after fees is approximated by subtracting the expense ratio from the annual gross return, then dividing by 12.
The future value formula is:
FV = PMT × [((1 + i)ⁿ − 1) ÷ i]
Where:
- PMT = Monthly investment
- i = Monthly return after fees
- n = Total monthly contributions
- FV = Future Value
Total contributions:
Total Contributions = Monthly Investment × Number of Months
Total Contributions = $500 × 360
Total Contributions = $180,000
For this simplified illustration, assume monthly contributions are made at the end of each month and the monthly return is calculated by dividing the assumed annual return after expenses by 12.
Using these assumptions:
- Investor A’s estimated final portfolio is approximately $735,000.
- Investor B’s estimated final portfolio is approximately $610,000.
The difference is approximately $125,000.
These are illustrative estimates, not guaranteed returns or a forecast for any specific ETF. Actual expense accrual, investment timing, market returns, and contribution dates will change the results.
Key lesson: Even when two investments earn identical returns before expenses, the lower-cost investment can leave substantially more money for the investor.
Real Case Study: Active Funds vs Passive Index Funds
One of the most important questions in investing is whether paying higher management fees for active management is worthwhile.
An actively managed fund attempts to outperform a benchmark. A passive fund generally attempts to replicate an index.
However, outperforming an index consistently after expenses is difficult.
What Does the SPIVA Research Show?
The S&P Dow Jones Indices publishes a research series called SPIVA (S&P Indices Versus Active). The S&P Dow Jones Indices publishes a research series called SPIVA (S&P Indices Versus Active). Its research compares actively managed funds with appropriate market benchmarks to evaluate how consistently active managers outperform or underperform their respective indexes.
Investors can review the SPIVA U.S. Year-End 2025 Scorecard to examine the research methodology, performance comparisons, and results across different fund categories and investment periods.
Its research compares actively managed funds with appropriate market benchmarks.
According to the SPIVA U.S. Year-End 2025 Scorecard, approximately 79% of active large-cap U.S. equity funds underperformed the S&P 500 during 2025. The research also examines longer periods, different fund categories, and survivorship bias. S&P Dow Jones Indices+1
More recent SPIVA data, dated June 30, 2026, reported that 90.49% of U.S. large-cap funds underperformed the S&P 500 over the preceding 15 years. S&P Dow Jones Indices
Why Is This Important?
Consider two hypothetical investment approaches:
Passive investor
- Invests in a broad-market index ETF.
- Pays a relatively low expense ratio.
- Accepts market returns before fund expenses.
- Avoids trying to predict which companies will outperform.
Active investor
- Invests in an actively managed ETF.
- Pays a higher management fee.
- Relies on the manager’s research and investment decisions.
- Attempts to outperform a benchmark.
An active ETF can outperform its benchmark, but its manager must generate enough additional return to compensate for the higher expenses and other costs.
For example:
| Particulars | Passive ETF | Active ETF |
|---|---|---|
| Gross annual return | 9% | 10% |
| Expense ratio | 0.05% | 1.00% |
| Approximate return after expense ratio | 8.95% | 9.00% |
The active ETF has only a small advantage after the assumed fund expenses, despite producing a 1-percentage-point higher gross return.
Important distinction: SPIVA’s findings do not prove that every active fund will underperform or that fees alone explain underperformance. They demonstrate the difficulty of consistently outperforming appropriate benchmarks.
ETF Expense Ratios vs Hidden Investment Costs
The expense ratio is important, but it does not represent every cost an ETF investor may experience.
A complete ETF cost analysis should consider the following.
10.1 Bid-Ask Spread
The bid-ask spread is the difference between the highest price a buyer is willing to pay and the lowest price a seller is willing to accept. Investors should also understand how ETF trading works and how trading-related expenses can affect investment returns. FINRA provides additional educational information in its guide to exchange-traded funds.
- Bid price: The price buyers are offering.
- Ask price: The price sellers are requesting.
- Spread: The difference between these prices.
Example:
Suppose an ETF has:
- Bid price: $100.00
- Ask price: $100.10
Spread Formula:
Bid-Ask Spread = Ask Price − Bid Price
Calculation:
Bid-Ask Spread = $100.10 − $100.00
Bid-Ask Spread = $0.10
The percentage spread relative to the midpoint is:
Formula:
Percentage Spread = (Bid-Ask Spread ÷ Midpoint Price) × 100
Midpoint Price = ($100.00 + $100.10) ÷ 2
Midpoint Price = $100.05
Calculation:
Percentage Spread = ($0.10 ÷ $100.05) × 100
Percentage Spread ≈ 0.10%
This cost can matter particularly when investors buy and sell frequently.
10.2 Brokerage Commissions
A brokerage commission is a fee charged by a broker for executing a transaction.
Some brokers offer commission-free ETF trading, while others may charge transaction fees.
Even when commissions are zero, other costs can remain.
10.3 Tracking Difference
Tracking difference measures how much an ETF’s actual performance differs from its benchmark over a particular period.
For example:
- Benchmark return: 10.00%
- ETF return: 9.90%
Formula:
Tracking Difference = ETF Return − Benchmark Return
Calculation:
Tracking Difference = 9.90% − 10.00%
Tracking Difference = −0.10 percentage points
The ETF underperformed its benchmark by 0.10 percentage points.
Tracking difference is not necessarily identical to the expense ratio because it can also reflect sampling, cash holdings, taxes, transaction expenses, securities lending revenue, and other factors.
10.4 Tracking Error
Tracking error measures the variability of the difference between an ETF’s returns and its benchmark returns over time.
This is different from tracking difference.
A fund can have a consistent negative tracking difference but relatively low tracking error if it underperforms by approximately the same amount each period.
10.5 Portfolio Turnover Costs
Portfolio turnover measures how frequently a fund replaces its holdings.
Higher turnover can increase:
- Trading expenses
- Market impact
- Bid-ask costs within the portfolio
- Potential taxable distributions
However, turnover alone does not establish whether an ETF is expensive. Investors should examine actual fund disclosures and performance.
10.6 Currency Conversion Costs
International ETFs may expose investors to foreign currencies.
Investors purchasing overseas ETFs may encounter currency conversion charges at the brokerage level.
Currency fluctuations can also affect the value of international investments.
10.7 Securities Lending
Some ETFs lend securities to other market participants in exchange for collateral and lending revenue.
This revenue can help offset fund expenses.
However, securities lending introduces counterparty, collateral, and operational risks. Investors should review the fund’s securities-lending disclosures.
Gross Expense Ratio vs Net Expense Ratio
Investors may see two different expense ratio figures in an ETF’s documentation.
Understanding the difference is important.
Gross Expense Ratio
The gross expense ratio represents the fund’s operating expenses before applicable fee waivers or expense reimbursements.
Net Expense Ratio
The net expense ratio reflects applicable waivers or reimbursements.
For example:
Suppose an ETF has:
- Gross expense ratio: 0.60%
- Expense waiver: 0.15 percentage points
Its net expense ratio would be:
Formula:
Net Expense Ratio = Gross Expense Ratio − Expense Waiver
Calculation:
Net Expense Ratio = 0.60% − 0.15%
Net Expense Ratio = 0.45%
The investor should check whether the waiver is temporary, when it expires, and whether it can be renewed.
A temporarily discounted expense ratio should not automatically be treated as a permanent cost.
Index ETFs vs Active ETFs: Which Has Lower Costs?
| Feature | Index ETF | Active ETF |
|---|---|---|
| Management | Follows an index or rules | Manager makes investment decisions |
| Research requirements | Generally lower | Often higher |
| Expense ratio | Often lower | Often higher |
| Investment objective | Track a benchmark or strategy | Seek a particular outcome or outperformance |
| Portfolio changes | Usually rules-based | Manager-directed |
| Outperformance potential | Usually aims to match benchmark before costs | May outperform or underperform |
| Main consideration | Tracking quality | Manager skill and fees |
Advantages of Index ETFs
- Generally lower operating expenses.
- Transparent investment methodology.
- Diversification through index exposure.
- Less dependence on individual stock-selection decisions.
- Convenient for long-term portfolio construction.
Advantages of Active ETFs
- Potential to outperform a benchmark.
- Ability to adjust holdings based on market conditions.
- Access to specialized investment strategies.
- Potential to manage specific risks or investment objectives.
Which Is Better?
There is no universal answer.
For investors seeking broad market exposure, a diversified, low-cost index ETF may be an efficient starting point.
An active ETF may be worth considering when its investment strategy provides a specific benefit that justifies its additional expenses.
The important question is not simply whether an ETF is active or passive.
It is whether the investment strategy provides sufficient value after all costs.
Why Do Some ETFs Have Higher Expense Ratios?
Not all ETFs have the same operating requirements.
Some investment strategies require additional research, specialized infrastructure, or more complex portfolio management.
13.1 Emerging-Market ETFs
Emerging-market ETFs invest in countries with developing financial markets.
They may involve:
- Different regulatory systems
- Foreign settlement arrangements
- Currency fluctuations
- Market liquidity challenges
- Political and economic risks
These factors can increase operating complexity.
13.2 Thematic ETFs
Thematic ETFs focus on specific investment trends, such as:
- Artificial intelligence
- Robotics
- Clean energy
- Cybersecurity
- Biotechnology
Some require specialized index methodologies and research.
However, a thematic strategy is not automatically worth a higher fee. Investors should examine diversification, holdings, valuation, and long-term investment risks.
13.3 Smart Beta ETFs
Smart beta ETFs use rules-based approaches that select or weight securities using investment factors.
Common factors include:
- Value
- Momentum
- Quality
- Low volatility
- Dividend growth
- Size
These funds may cost more than traditional market-cap-weighted index ETFs because their strategies involve additional screening and rebalancing.
13.4 Leveraged and Inverse ETFs
Leveraged ETFs use derivatives and other financial instruments to seek a multiple of the daily return of an underlying index.
For example:
- A 2x leveraged ETF targets approximately twice the index’s daily return.
- An inverse ETF seeks the opposite of an index’s daily return.
Their expenses and structural risks can be higher.
Importantly, daily leveraged returns do not simply multiply long-term index returns. Daily compounding and volatility can produce very different long-term results.
These products generally require more active monitoring than traditional long-term index ETFs.
13.5 Bond ETFs
Bond ETFs may invest in:
- Government securities
- Corporate bonds
- Municipal bonds
- High-yield bonds
- Emerging-market debt
Specialized bond funds may require additional credit research and trading operations.
Are Zero-Expense-Ratio ETFs Really Free?
Some ETFs advertise a 0.00% expense ratio.
This can be attractive, but investors should understand the entire fund structure.
A zero expense ratio means the stated annual operating expense ratio is zero during the applicable period. It does not automatically mean the investment has no costs.
Investors may still encounter:
- Bid-ask spreads
- Brokerage charges
- Portfolio transaction costs
- Taxes
- Currency conversion expenses
A fund provider may also earn revenue through other permitted activities, depending on its business model and fund structure.
Investor lesson: Never evaluate an ETF only by its advertised expense ratio. Read its prospectus and understand the total cost of ownership.
How to Compare ETF Expense Ratios Before Investing
Before purchasing an ETF, follow a structured comparison process. Investors who are new to the financial markets should first understand how to start investing and establish a suitable investment approach before selecting exchange-traded funds.
Step 1: Identify the Investment Objective
First, understand what the ETF is designed to accomplish.
Does it provide:
- U.S. large-cap exposure?
- Global stock diversification?
- Bond-market exposure?
- Dividend income?
- Sector-specific exposure?
Compare funds with similar investment objectives rather than comparing unrelated products solely because one has a lower fee.
Step 2: Check the Expense Ratio
Find the expense ratio in the official fund factsheet or prospectus. Investors comparing U.S.-listed ETFs can also use the Vanguard ETF Fund Comparison Tool to examine fund characteristics and compare investment costs. Always verify the latest expense information in the individual fund’s official prospectus or website.
Do not rely exclusively on third-party summaries that may contain outdated information.
Step 3: Compare Tracking Difference
Examine how closely the fund has followed its benchmark over several periods.
Look for persistent differences rather than focusing on one unusual year.
Step 4: Evaluate Liquidity
Consider:
- Trading volume
- Assets under management
- Bid-ask spreads
- Market-maker participation
Liquidity can influence the cost of entering and exiting an investment.
Step 5: Examine Portfolio Holdings
Check whether the ETF actually provides the exposure you want.
Two ETFs with similar names can have different holdings, concentrations, and investment methodologies.
Step 6: Review Tax Implications
Tax treatment depends on the investor’s country of residence, account type, fund domicile, and applicable tax regulations.
For example, an Indian resident investing in overseas ETFs should consider foreign exchange conversion, overseas investment rules, applicable Indian tax treatment, and potential foreign withholding taxes.
A U.S. investor may face different tax considerations.
Step 7: Calculate the Actual Dollar Cost
Use the following formula:Step 7: Calculate the Actual Dollar Cost
Use the following formula:
Annual Fund Cost = Investment Value × (Expense Ratio ÷ 100)
Example:
An investor holds $250,000 in an ETF with an expense ratio of 0.15%.
Calculation:
Annual Fund Cost = $250,000 × (0.15 ÷ 100)
Annual Fund Cost = $250,000 × 0.0015
Annual Fund Cost = $375
Approximate annual expense: $375.
Step 8: Review the Prospectus
The prospectus provides information about:
- Investment objectives
- Fees and expenses
- Portfolio risks
- Holdings policies
- Tracking methodology
- Fund operations
It is one of the most important documents to review before investing.
ETF Expense Ratios for Retirement Planning
Expense ratios are especially important for retirement investors because retirement portfolios may remain invested for several decades.
A retirement investor may contribute regularly throughout their working life and withdraw money gradually during retirement.
The combination of contributions, investment returns, and expenses can significantly influence the final portfolio value.
Example: Retirement Portfolio Cost
Suppose an investor has a retirement portfolio worth $500,000.
| Expense ratio | Approximate annual expense |
|---|---|
| 0.03% | $150 |
| 0.10% | $500 |
| 0.25% | $1,250 |
| 0.50% | $2,500 |
| 1.00% | $5,000 |
The table assumes the portfolio value remains constant throughout the year.
In practice, expenses change as the portfolio value changes.
Why Retirement Investors Should Compare Fees
A retirement investor may have limited opportunities to increase income after leaving employment.
Keeping unnecessary investment expenses low can help preserve capital for future withdrawals.
However, retirement investing also requires consideration of:
- Asset allocation
- Inflation
- Withdrawal rates
- Longevity risk
- Market volatility
- Tax efficiency
- Liquidity requirements
A low expense ratio cannot compensate for an unsuitable asset allocation or an excessively risky portfolio. Investors should therefore understand different asset allocation strategies when selecting ETFs for a diversified portfolio.
ETF Expense Ratios for International Investors
ETF expenses and investment costs can differ depending on the investor’s country.
United States
The U.S. ETF market has extensive competition, large fund providers, and many low-cost broad-market ETFs.
Examples include funds from Vanguard, iShares, State Street, and Schwab.
United Kingdom and Europe
European investors commonly encounter UCITS ETFs.
UCITS stands for Undertakings for Collective Investment in Transferable Securities.
It is a European regulatory framework for certain investment funds.
When comparing UCITS ETFs, investors should examine:
- Ongoing charges figure (OCF)
- Tracking difference
- Fund domicile
- Replication method
- Currency exposure
- Distribution or accumulation policy
The OCF is a useful cost measure, but it should not automatically be treated as identical to every U.S. ETF expense disclosure.
Canada
Canadian investors can compare domestic ETFs and international ETFs listed on Canadian exchanges.
Currency exposure, fund structure, withholding taxes, and trading spreads can affect overall costs.
Australia
Australian investors can evaluate ETFs listed on the Australian Securities Exchange (ASX).
They should review management costs, indirect cost ratios where applicable, brokerage fees, and the fund’s product disclosure statement.
India
Indian investors can access domestic ETFs and, subject to applicable rules and platform availability, international investment products.
Important considerations include:
- Total expense ratio (TER)
- Tracking error
- Tracking difference
- Liquidity
- Domestic taxation
- International investment regulations
- Currency conversion
Important: Expense ratio terminology and disclosure standards are not identical across all countries. Always compare the appropriate fund-level cost measure for the product’s jurisdiction.
What Is the Difference Between ETF Expense Ratios and Mutual Fund Expense Ratios?
Both ETFs and mutual funds charge expenses to operate their portfolios. Investors comparing different fund structures should also understand the differences between index funds and ETFs, including their trading methods, costs, and investment structures.
However, they differ in how investors buy and sell their shares.
| Feature | ETF | Mutual Fund |
|---|---|---|
| Trading | Throughout exchange trading hours | Usually priced once daily |
| Pricing | Market price | NAV-based transaction price |
| Expense ratio | Varies | Varies |
| Brokerage | May apply | Depends on distribution arrangement |
| Bid-ask spread | Applicable to exchange-traded shares | Generally not applicable in the same way |
| Management style | Active or passive | Active or passive |
It is incorrect to assume that every ETF is cheaper than every mutual fund.
Low-cost index mutual funds can compete with ETFs on expense ratios.
Investors should compare equivalent strategies, share classes, and total costs.
The Future of ETF Expense Ratios
The ETF industry has changed significantly as investment technology, automation, and competition have improved.
Several developments may influence future ETF expenses.
Increasing Competition
Large investment companies compete for assets by offering attractive fees and investment strategies.
This has helped reduce costs in many mainstream index ETF categories.
Automated Portfolio Management
Technology allows investment managers to process large amounts of portfolio information efficiently.
Automation can reduce certain administrative and operational expenses.
Growth of Specialized ETFs
Thematic, active, options-based, and alternative investment ETFs are expanding the range of products available to investors.
These funds may charge more than basic index funds because of their additional complexity.
Greater Investor Awareness
Investors increasingly compare expense ratios, tracking differences, portfolio transparency, and total ownership costs.
This encourages fund providers to explain their fees more clearly.
The important point: Not every ETF fee will approach zero. Specialized investment products may continue charging higher expenses when their operating structures and strategies justify them.
Common ETF Expense Ratio Mistakes Investors Should Avoid
Even experienced investors sometimes overlook important details when evaluating ETF expenses.
Mistake 1: Choosing an ETF Only Because It Has the Lowest Fee
A low expense ratio does not guarantee better investment performance.
An ETF may have poor liquidity, high tracking differences, concentrated holdings, or an unsuitable investment strategy.
Mistake 2: Ignoring the Bid-Ask Spread
An ETF with a low expense ratio may still be expensive to trade.
Always examine the spread, especially for smaller or less frequently traded funds.
Mistake 3: Confusing Expense Ratio With Total Cost
The expense ratio covers specified fund operating expenses, not every possible investment cost.
Investors should also consider brokerage commissions, trading spreads, taxes, and currency conversion charges.
Mistake 4: Comparing Different Types of ETFs
Comparing a broad-market ETF with a leveraged or specialized thematic ETF based only on fees can be misleading.
Compare products that provide similar investment exposure.
Mistake 5: Ignoring Temporary Fee Waivers
A promotional net expense ratio may increase when a fee waiver expires.
Check the gross expense ratio and waiver agreement.
Mistake 6: Ignoring Long-Term Compounding
A small annual fee difference can have a significant cumulative impact over several decades.
Use a compound-growth calculator to understand the potential effect.
Mistake 7: Assuming Past Performance Guarantees Future Returns
An ETF that outperformed its benchmark historically may not continue doing so.
Past performance should be considered alongside costs, investment strategy, and risk.
ETF Expense Ratios Explained: Frequently Asked Questions
1. What is an ETF expense ratio in simple terms?
An ETF expense ratio is the annual operating expense of an exchange-traded fund expressed as a percentage of its average net assets. It represents the cost of operating the fund and is generally reflected in its NAV rather than billed separately to investors.
2. Is a 0.03% ETF expense ratio good?
Generally, 0.03% is a very low expense ratio for a broad-market index ETF. For example, Vanguard’s VOO and iShares’ IVV have published expense ratios of 0.03% in their respective fund disclosures. However, investors should also examine tracking quality, liquidity, portfolio holdings, and taxes. Vanguard+1
3. How much does a 1% ETF expense ratio cost?
A 1% expense ratio represents approximately $100 in annual fund expenses for every $10,000 invested, assuming the investment value remains constant throughout the year.
For a $100,000 investment, the approximate annual expense is $1,000.
4. Are ETF expense ratios deducted monthly or annually?
Expense ratios are quoted as annual percentages, but fund expenses are generally accrued over time and reflected in the fund’s assets and NAV. Investors typically do not receive a separate monthly or annual bill.
5. Can ETF expense ratios change?
Yes. Fund providers may change their fees, introduce or discontinue fee waivers, or modify operating arrangements. Investors should check the latest prospectus and official fund website.
6. Are ETFs with zero expense ratios completely free?
No. A 0.00% expense ratio does not necessarily eliminate brokerage charges, bid-ask spreads, taxes, currency conversion costs, or other transaction-related expenses.
7. Why are index ETFs generally cheaper than active ETFs?
Index ETFs usually follow a predefined benchmark or rules-based methodology. This can reduce research and discretionary portfolio-management requirements. Active ETFs may require additional research and portfolio management, which can increase expenses.
8. Do ETF expense ratios affect dividend payments?
Yes, indirectly. Fund operating expenses reduce the assets available to investors and can therefore affect the fund’s overall returns and distributable income. However, an expense ratio is not a separate percentage deducted directly from each dividend payment received by an investor.
9. What is the difference between expense ratio and tracking error?
An expense ratio measures the fund’s stated annual operating expenses relative to its assets. Tracking error measures the variability of the difference between an ETF’s returns and its benchmark returns over time. They measure different aspects of fund costs and performance.
10. Are ETF expense ratios better than mutual fund expense ratios?
Neither structure is automatically cheaper. Both ETFs and mutual funds can have low-cost and high-cost products. Compare equivalent investment strategies, operating expenses, trading costs, and tax implications.
11. What is the difference between gross and net expense ratios?
The gross expense ratio represents operating expenses before applicable waivers or reimbursements. The net expense ratio reflects those waivers or reimbursements. A net expense ratio may increase when a temporary fee waiver expires.
12. How do I calculate ETF expenses on a $50,000 investment?
Multiply the investment amount by the expense ratio expressed as a decimal.
For a 0.20% expense ratio:
Annual Fund Expense = $50,000 × (0.20 ÷ 100)
Annual Fund Expense = $50,000 × 0.002
Annual Fund Expense = $100
The approximate annual expense is $100, assuming the investment value remains constant.
13. Are expensive ETFs always bad investments?
No. Certain specialized or actively managed ETFs may offer investment exposure or strategies that justify higher operating expenses. However, investors should evaluate whether the strategy provides sufficient potential value after costs.
14. How often should I review an ETF’s expense ratio?
Review the expense ratio when initially selecting an ETF and periodically afterward, particularly when the fund provider announces a fee change, a waiver expires, or a competing fund becomes available. Checking the latest prospectus annually is a reasonable practice.
15. What matters more: expense ratio or ETF performance?
Both matter. Performance indicates how an investment has performed over a particular period, while the expense ratio measures one component of its cost. Investors should compare risk-adjusted, after-expense performance against an appropriate benchmark rather than selecting funds solely by historical returns or fees.
Practical ETF Expense Ratio Comparison Checklist
Use this checklist before investing in an ETF.
- Check the official expense ratio.
- Compare gross and net expenses.
- Review any fee waivers.
- Examine the underlying index.
- Compare tracking difference.
- Evaluate tracking error.
- Check assets under management.
- Review bid-ask spreads.
- Examine portfolio holdings.
- Understand the fund’s investment strategy.
- Consider currency and taxation.
- Read the latest prospectus.
The objective is to identify a suitable ETF with reasonable ongoing costs, appropriate diversification, and investment characteristics that match your financial goals.
Key Takeaways: ETF Expense Ratios Explained
ETF expense ratios are among the most important costs to understand before investing in exchange-traded funds.
Here are the most important lessons:
- An expense ratio represents the annual operating expenses of an ETF as a percentage of its average net assets.
- Fund expenses are generally deducted from fund assets rather than charged separately to investors.
- Lower expense ratios can improve long-term net investment returns when other factors are equal.
- Compounding makes recurring fees particularly important over long investment periods.
- Index ETFs generally have lower operating expenses than many actively managed funds.
- Expense ratios do not represent every investment cost.
- Tracking difference, liquidity, bid-ask spreads, and taxes also matter.
- The cheapest ETF is not necessarily the best ETF.
- Investors should compare funds with similar objectives and investment exposures.
- Reviewing official fund disclosures helps prevent decisions based on outdated fee information.
Conclusion: Why Understanding ETF Expense Ratios Can Improve Your Investment Decisions
ETF Expense Ratios Explained is more than a basic investing concept. It is an important part of understanding how investment costs affect long-term wealth creation.
A difference between 0.03% and 1.00% may appear small when viewed as an annual percentage. However, recurring expenses can reduce the amount of money available for compounding over decades.
Real-world funds such as VOO and IVV demonstrate how competitive pricing has made broad-market index investing relatively inexpensive. Meanwhile, SPIVA research highlights the difficulty many active managers face when attempting to outperform their benchmarks consistently.
However, successful ETF selection requires more than finding the lowest expense ratio.
Investors should examine the fund’s investment objective, diversification, liquidity, tracking performance, taxation, and total ownership costs.
For long-term investors, a sensible approach is to choose diversified investments, avoid unnecessary expenses, maintain an appropriate asset allocation, and remain disciplined through different market conditions.
Remember: You cannot control market returns, but you can make informed decisions about the investment costs you pay.
Financial Disclaimer
This article is provided for educational and informational purposes only. It does not constitute personalized financial, investment, legal, or tax advice. Investment values can rise or fall, and investors may lose some or all of their invested capital. Expense ratios, fund performance, tax treatment, and investment regulations may change. Always review the latest official fund documents and consider consulting a qualified financial professional before making investment decisions.
External Sources and Further Reading
The following authoritative resources provide additional information about ETF investment costs, fund disclosures, trading practices, and active versus passive investment performance.
- SEC Investor.gov – Mutual Funds and ETFs
- FINRA – Exchange-Traded Funds
- Vanguard – ETF Fund Comparison Tool
- iShares – IVV Official Fund Information
- S&P Dow Jones Indices – SPIVA U.S. Year-End 2025
Editorial sources and fact-checking
- Vanguard – VOO expense ratio and fund comparison — published 0.03% expense ratio, with fund data dated November 10, 2026.
- BlackRock iShares – IVV official fees and fund information — published 0.03% expense ratio.
- S&P Dow Jones Indices – SPIVA U.S. Year-End 2025 — active fund performance research.
- S&P Dow Jones Indices – SPIVA latest data — performance data through June 30, 2026.
- U.S. SEC Investor.gov — investor education and fund-cost disclosures.
- FINRA Investor Education — ETF trading and investor cost information.
All fund fees and performance statistics should be checked against the latest available official disclosures before publication.