Introduction: Stock Market Cycles Explained
Stock Market Cycles Explained is an essential topic for investors who want to understand why stock prices rise, fall, recover and sometimes remain stagnant for extended periods. Whether you invest in US stocks, UK shares, Canadian equities or Australian ETFs, understanding market cycles can help you make more informed investment decisions and avoid reacting emotionally to short-term market movements. If you’re building your foundational knowledge, explore our complete stock market investing guide for a broader understanding of stocks, market fundamentals and investing concepts.
The stock market does not move upward continuously. It experiences periods of economic expansion, investor optimism, excessive speculation, market corrections and recovery. These movements are influenced by corporate earnings, inflation, interest rates, employment, government policies, technological developments and investor psychology.
For example, the 2008 Global Financial Crisis caused the S&P 500 to decline approximately 57% from its October 2007 peak to its March 2009 trough. However, the market subsequently recovered and entered a prolonged period of expansion.
Similarly, the COVID-19 market crash in 2020 demonstrated how quickly market conditions can change. Investors experienced a dramatic decline followed by a remarkably rapid recovery.
Understanding these historical events can help investors prepare for uncertainty rather than attempting to predict every market movement.
In this guide, we examine the four major stages of stock market cycles, explain important financial terminology, explore historical case studies, demonstrate investment formulas and discuss practical strategies for managing portfolios through different market conditions.
What Are Stock Market Cycles?
A stock market cycle is the recurring pattern of rising, declining and recovering stock prices over time. It reflects changes in economic conditions, business performance, investment expectations and market sentiment.
A market cycle does not follow a fixed timetable. Some cycles develop over several months, while others continue for many years. If you are new to investing, our beginner’s guide to investing explains the fundamentals of getting started, understanding investment risk and developing an investing plan.
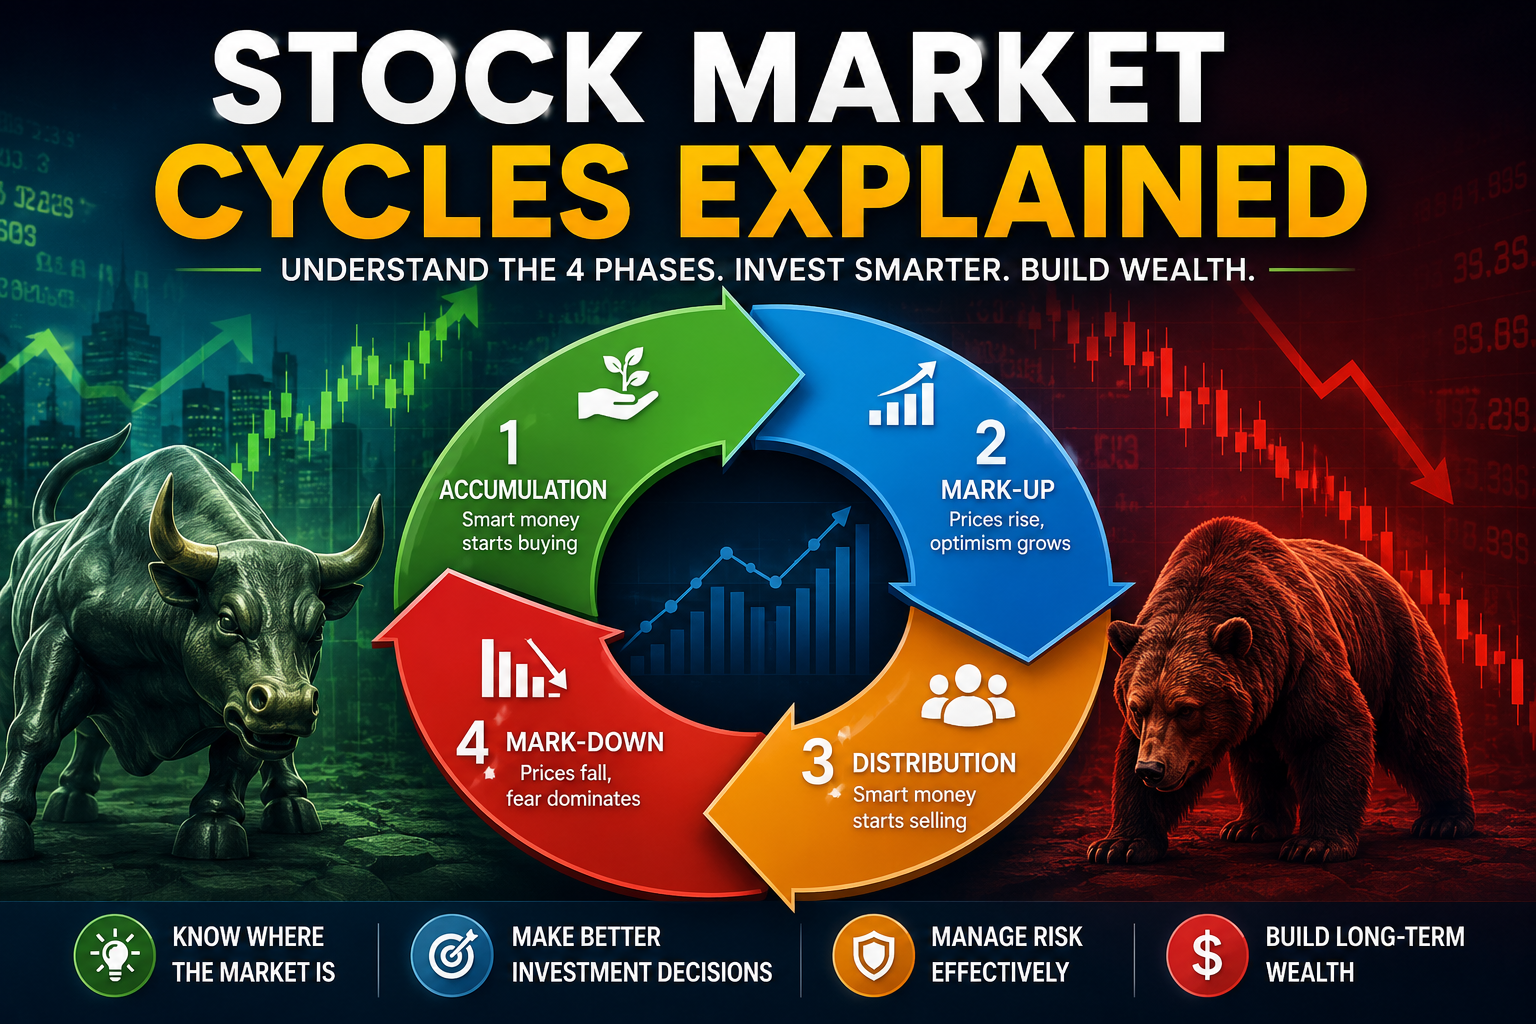
The traditional four-stage market cycle consists of:
- Accumulation: Investors begin purchasing assets after a significant decline.
- Mark-Up: Prices rise as economic conditions and investor confidence improve.
- Distribution: Optimism becomes excessive, valuations may become stretched and experienced investors begin reducing exposure.
- Mark-Down: Prices decline as economic conditions weaken and investors become increasingly concerned.
These four stages are useful for understanding market behaviour, but they are not guaranteed to occur in a perfectly predictable sequence.
Stock Market Cycles vs Economic Cycles
Stock market cycles and economic cycles are closely connected, but they are not identical.
An economic cycle describes changes in overall economic activity. A stock market cycle describes changes in financial asset prices.
The four conventional stages of an economic cycle are:
- Expansion: Economic production, employment, consumer spending and business investment increase.
- Peak: Economic activity reaches a cyclical high before slowing.
- Contraction: Economic activity declines across different parts of the economy.
- Trough: Economic activity reaches a low point before recovery begins.
The National Bureau of Economic Research (NBER) uses a broad range of economic indicators to determine US recession dates. These include employment, personal income, industrial production and real consumer spending.
Importantly, the stock market frequently changes direction before the economy reaches an officially identified turning point. Investors make decisions based on expectations of future business performance rather than waiting for economic reports to confirm what has already happened.
Why Do Stock Market Cycles Happen?
Stock market cycles develop because economic conditions, financial markets and investor expectations continually change.
Understanding their main drivers helps investors interpret market movements more effectively.
1. Interest Rates and Central Bank Policy
Interest rates represent the cost of borrowing money. Central banks influence financial conditions by changing policy interest rates and using other monetary policy tools.
Important central banks include:
- Federal Reserve (US)
- Bank of England (UK)
- Bank of Canada (Canada)
- Reserve Bank of Australia (Australia)
When interest rates decrease, borrowing can become less expensive. Businesses may invest in equipment, expansion and hiring, while consumers may increase spending.
Lower interest rates can also increase the attractiveness of stocks compared with some interest-bearing investments.
However, lower interest rates do not automatically cause stock prices to rise. If rates are reduced because economic conditions are deteriorating, falling corporate earnings may outweigh the benefits.
When interest rates increase, companies face higher financing costs. Consumers may reduce borrowing, and investors may demand higher returns before purchasing risky assets.
2. Inflation and Purchasing Power
Inflation is the rate at which the general price level of goods and services increases over time.
For example, if annual inflation is 4%, something costing $100 today would cost approximately $104 after one year, assuming the same inflation rate.
High inflation can affect stock markets through:
- Higher employee wages.
- Increased raw material expenses.
- Reduced consumer purchasing power.
- Lower corporate profit margins.
- Higher central bank interest rates.
However, the impact differs between industries. Some businesses can pass increased costs to customers, while others struggle to maintain profitability.
3. Corporate Earnings and Business Growth
Corporate earnings represent the profits businesses generate after expenses.
Investors examine revenue, operating margins, earnings per share (EPS), cash flow and future earnings guidance to evaluate companies.
For example, a technology company reporting strong revenue growth and improving profitability may attract additional investment.
Conversely, a company reporting declining sales, rising debt and weaker profit margins may experience falling share prices.
4. Investor Psychology
Investor psychology describes how emotions and expectations influence financial decisions.
The most common emotions during market cycles include:
| Market condition | Common investor emotion |
|---|---|
| Market decline | Fear |
| Early recovery | Doubt |
| Sustained growth | Optimism |
| Market speculation | Greed |
| Market crash | Panic |
Fear and greed can cause investors to purchase assets at excessive prices or sell quality investments during temporary downturns.
5. Global Events and Geopolitical Risks
International events can also influence stock market cycles.
Examples include:
- Wars and geopolitical conflicts.
- Global pandemics.
- Energy supply disruptions.
- Trade restrictions and tariffs.
- Banking crises.
- Technological breakthroughs.
These events can affect supply chains, corporate profits, commodity prices, currency markets and investor confidence.
The Four Main Phases of Stock Market Cycles Explained
The four-stage framework provides a practical way to understand how financial markets move from pessimism to optimism and eventually back toward uncertainty.
1. Accumulation Phase: When Long-Term Investors Start Buying
The accumulation phase generally develops after a significant market decline.
Investor confidence is weak, financial news may be negative and many investors remain concerned about further losses.
However, some long-term investors begin purchasing shares in businesses they believe have attractive valuations and sustainable financial prospects.
Important characteristics of accumulation:
- Stock valuations may become more attractive.
- Investor sentiment remains pessimistic.
- Trading activity may be subdued.
- Economic data may still be weak.
- Some institutional and long-term investors begin accumulating assets.
- Market prices may gradually stabilize.
Important financial terms:
Undervalued stock: A share trading below an investor’s estimate of its intrinsic value.
Intrinsic value: An estimate of what a company is worth based on its expected future cash flows, assets, earnings and business risks.
Institutional investors: Professional organisations such as pension funds, insurance companies, mutual funds and investment managers that invest large amounts of capital.
Trading volume: The number of shares exchanged during a particular period.
Real Case Study: The 2009 Market Recovery
The Global Financial Crisis of 2007–2009 provides an important example of market accumulation and recovery.
The S&P 500 reached a major peak in October 2007 before declining sharply during the financial crisis. By March 2009, it had lost approximately 57% of its peak value.
Financial institutions faced serious problems, housing prices declined, unemployment increased and investors became extremely cautious.
As financial conditions gradually stabilized and policy support was introduced, investors began reassessing the long-term prospects of businesses.
The March 2009 market low became the starting point of a major subsequent bull market.
Investor lesson: Market bottoms are difficult to identify in real time. Investors should evaluate company fundamentals, diversification and their financial objectives instead of assuming that every large decline represents a buying opportunity.
2. Mark-Up Phase: When Stock Prices Begin Rising
The mark-up phase is characterized by sustained upward movement in stock prices.
Economic activity often improves, corporate earnings strengthen and investors become more confident about future business conditions.
During this stage, businesses may experience:
- Increasing sales.
- Improving profitability.
- Higher consumer demand.
- Greater capital investment.
- Expanding employment.
- Better access to financing.
Investors may become increasingly willing to pay higher valuations for companies with strong future growth prospects.
Important financial terms:
Bull market: A market environment characterized by a sustained rise in prices. A widely used convention identifies a bull market as a 20% or greater increase from a recent low.
Capital appreciation: An increase in the market value of an investment.
Earnings per share (EPS): A company’s profit attributable to each outstanding common share.
Price-to-earnings ratio (P/E): A valuation measure comparing a company’s share price with its earnings per share.
Real Case Study: The 2009–2021 US Bull Market
Following the 2008 financial crisis, US equities experienced an extended period of growth.
The S&P 500 benefited from recovering corporate earnings, economic expansion, technological innovation and accommodative monetary conditions during much of this period.
Major technology businesses such as Apple, Microsoft and Amazon expanded their operations and developed important positions in global markets.
The technology sector benefited from developments in:
- Cloud computing.
- E-commerce.
- Digital advertising.
- Smartphones.
- Software subscriptions.
- Data infrastructure.
The prolonged market expansion demonstrated how innovation and business growth can support rising equity valuations. Investors who want to turn these lessons into a consistent plan can explore our long-term investing strategies guide, which covers portfolio construction, asset allocation and managing investment risk over time.
However, not every company performed equally well. Investors who concentrated their portfolios in a small number of expensive stocks faced different risks from those holding diversified investments.
Investor lesson: A bull market can create opportunities, but rising prices do not eliminate valuation risk. Investors should evaluate earnings quality, debt levels and long-term business prospects.
3. Distribution Phase: When Optimism and Valuations Become Excessive
The distribution phase generally develops near a market peak.
Stock prices may remain elevated even as some investors become increasingly concerned about valuations, economic conditions or the sustainability of corporate earnings.
During this period, market optimism can become excessive.
Common characteristics include:
- Elevated stock valuations.
- Increasing speculative activity.
- Strong retail investor participation.
- High expectations for future earnings.
- Greater interest in newly listed companies.
- Increased market volatility.
- Some investors reducing their exposure.
Important financial terms:
Market capitalization: The total market value of a company’s outstanding shares.
Speculation: Purchasing an investment primarily because of expectations of future price movements, often involving substantial uncertainty.
FOMO: Fear of Missing Out. It describes buying an asset because of concerns that other investors are making money without you.
Asset bubble: A situation in which market prices rise substantially beyond levels supported by underlying economic fundamentals, often followed by a sharp correction.
Real Case Study: The Dot-Com Bubble (1995–2002)
The late 1990s witnessed enormous enthusiasm surrounding internet businesses.
Investors expected the internet to transform commerce, communication and business operations.
Many technology companies attracted substantial investment despite having limited revenue or no sustainable profits.
The Nasdaq Composite rose rapidly and reached approximately 5,048 points on March 10, 2000.
However, investor expectations eventually became difficult to justify.
As confidence weakened, technology shares experienced substantial selling pressure.
By October 2002, the Nasdaq had fallen to approximately 1,140 points, representing a decline of roughly 77% from its peak.
The collapse demonstrated that a promising technology can transform the economy without every company associated with that technology becoming a successful investment.
Investor lesson: Strong innovation does not automatically justify any stock valuation. Investors should examine revenue, cash flow, profitability, competitive advantages and the price paid for future growth. A sustainable financial plan requires more than identifying market opportunities. Explore our guide to building long-term wealth for broader principles of saving, investing and managing risk over time.
4. Mark-Down Phase: When Markets Experience Significant Declines
The mark-down phase occurs when selling pressure increases and stock prices begin falling.
This can happen because of:
- Declining corporate earnings.
- Rising interest rates.
- Economic contraction.
- Financial instability.
- Unexpected geopolitical events.
- Excessive valuations.
- Weakening investor confidence.
Important financial terms:
Bear market: A market decline of approximately 20% or more from a recent peak.
Market correction: A decline of approximately 10% or more from a recent market high.
Volatility: The degree and speed of price fluctuations over a particular period.
Liquidity: The ability to buy or sell an investment without causing a substantial change in its price.
Drawdown: The percentage decline in an investment’s value from a previous peak to a subsequent low.
Real Case Study: The COVID-19 Market Crash (2020)
The COVID-19 pandemic caused a sudden disruption to economic activity around the world.
Businesses temporarily closed, international travel declined and uncertainty increased across financial markets.
The S&P 500 declined approximately 34% between February 19 and March 23, 2020.
Central banks and governments introduced extraordinary monetary and fiscal support measures.
Financial markets subsequently recovered rapidly, although the recovery differed across sectors and individual companies.
Technology businesses benefited from increased demand for remote working, online services and digital infrastructure, while industries such as travel and hospitality experienced substantial disruption.
Investor lesson: A sharp market decline does not always mean that the economy will experience a prolonged recession. Investors should evaluate the cause of the decline, their investment time horizon and their ability to withstand further losses.
Stock Market Cycles vs Bull Markets and Bear Markets
Bull and bear markets describe important price trends within broader market cycles.
| Feature | Bull market | Bear market |
|---|---|---|
| Price direction | Generally rising | Generally falling |
| Investor sentiment | Optimistic | Pessimistic |
| Business expectations | Improving | Weakening |
| Risk appetite | Often increasing | Often decreasing |
| Common behaviour | Buying and holding | Selling and seeking safety |
| Main concern | Overvaluation | Further losses |
A bull market does not mean every stock rises. Similarly, a bear market does not mean every investment declines.
Some industries may perform relatively well during difficult economic conditions, depending on demand, valuations, interest rates and company fundamentals.
How Interest Rates Influence Stock Market Cycles
Interest rates are among the most important economic factors influencing equity valuations.
A simplified way to understand this relationship is through discounted cash flow valuation.
The present value of future cash flows can be represented as:
PV = CF / (1 + r)ⁿ
Where:
- PV = Present value.
- CF = Future cash flow.
- r = Discount rate.
- n = Number of periods.
Suppose an investor expects to receive $1,000 in five years and uses a 5% discount rate.
PV = $1,000 / (1.05)⁵
Present value is approximately $783.53.
If the discount rate increases to 8%, the present value falls to approximately $680.58.
This simplified example demonstrates why higher discount rates can reduce the present value of distant future earnings.
However, actual stock valuations depend on multiple variables, including expected cash flows, growth rates, risk premiums and capital structure.
How Inflation Influences Market Cycles
Inflation affects both businesses and households.
When prices rise rapidly, consumers may have less disposable income available for discretionary purchases.
Companies may experience higher production expenses, transportation costs and employee compensation.
For example:
Suppose a manufacturing company generates annual revenue of $10 million and operating expenses of $8 million.
Its operating profit is:
$10 million − $8 million = $2 million.
Now suppose operating costs increase by 10%, while revenue remains unchanged.
New expenses = $8.8 million.
New operating profit = $1.2 million.
The company’s operating profit has declined by 40%, even though revenue has not changed.
This example demonstrates how rising costs can affect corporate profitability.
However, the effect of inflation varies across industries. Businesses with strong pricing power may be better positioned to pass higher costs to customers.
Sector Rotation During Stock Market Cycles
Sector rotation refers to investors shifting their investments between different industries as economic conditions and expectations change.
Different sectors have different sensitivities to interest rates, inflation, employment and consumer demand.
| Economic environment | Sectors investors may examine |
|---|---|
| Early recovery | Financials, consumer discretionary, industrials |
| Economic expansion | Technology, industrials, consumer discretionary |
| Late-cycle conditions | Healthcare, utilities, consumer staples |
| Economic contraction | Healthcare, utilities, consumer staples |
These are historical tendencies, not guaranteed predictions.
For example, technology companies may benefit from improving business investment, but expensive growth stocks can also be vulnerable to rising interest rates.
Similarly, energy companies may benefit from higher commodity prices, even when broader economic growth is slowing.
Investors should evaluate individual company fundamentals rather than automatically rotating into a particular sector. For another way to spread exposure across companies and industries, learn about building a diversified investment portfolio using ETFs and index funds.
Important Economic Indicators for Understanding Stock Market Cycles
Investors monitor economic indicators to understand whether economic conditions are improving or weakening.
1. Gross Domestic Product (GDP)
GDP measures the value of final goods and services produced within an economy during a specified period.
Increasing real GDP generally indicates economic expansion, while declining real GDP can signal weakening economic activity.
However, GDP data are released with delays and can be revised.
2. Consumer Price Index (CPI)
CPI measures changes in the prices consumers pay for a basket of goods and services.
Investors monitor inflation data because it can influence central bank decisions, interest rates and household spending.
3. Unemployment Rate
The unemployment rate measures the percentage of the labour force that is unemployed and actively seeking employment.
Rising unemployment can indicate weakening economic conditions.
However, employment indicators can lag changes in economic activity.
4. Purchasing Managers’ Index (PMI)
PMI measures business activity and sentiment through surveys of purchasing managers.
A reading above 50 generally indicates expansion compared with the previous survey period, while a reading below 50 indicates contraction.
5. Yield Curve
A yield curve compares interest rates on bonds with different maturities.
An inverted yield curve occurs when shorter-term government bond yields are higher than longer-term yields.
Historically, some yield curve inversions have preceded recessions, but the timing and reliability of this relationship are not guaranteed.
6. Corporate Earnings
Corporate earnings reports help investors assess whether businesses are growing, maintaining profitability or experiencing financial difficulties.
Investors should examine earnings alongside revenue, cash flow, debt and management guidance. To learn how economic data, market trends and financial developments fit together, read our guide to understanding financial markets.
Real Case Study: The 2008 Global Financial Crisis
The Global Financial Crisis demonstrates how financial instability can turn an extended market expansion into a severe downturn.
What Happened Before the Crisis?
During the years leading up to 2008:
- US housing prices increased substantially.
- Mortgage lending expanded.
- Financial institutions developed complex mortgage-related securities.
- Some borrowers received loans they struggled to repay.
- Risk management practices proved inadequate.
Why Did the Market Collapse?
As housing prices declined, mortgage defaults increased.
Financial institutions experienced major losses, credit markets became severely disrupted and confidence weakened.
Lehman Brothers filed for bankruptcy in September 2008.
The resulting financial stress affected businesses, households and financial markets around the world.
What Happened During Recovery?
Governments and central banks introduced emergency measures to stabilize financial systems and support economic activity. The Federal Reserve’s history of the Great Recession provides additional background on the financial crisis and the policy response.
The US recession officially lasted from December 2007 to June 2009, according to NBER.
The S&P 500 declined approximately 57% between its October 2007 peak and March 2009 trough.
Key lesson: Financial leverage, weak lending standards and excessive risk-taking can amplify market downturns. Diversification and understanding financial risks are essential.
Real Case Study: The 2022 Inflation and Interest Rate Shock
The 2022 market decline provides a different example of how monetary policy can influence stock valuations.
Following the COVID-19 disruption, inflation increased substantially in many economies.
Central banks responded by raising interest rates to control inflation.
Higher rates increased borrowing costs and changed the valuation of future corporate earnings.
Growth-oriented technology stocks were particularly sensitive to changing discount rates and investor expectations.
This episode demonstrated that markets can decline even when unemployment remains relatively low and parts of the economy continue expanding.
Key lesson: Investors should monitor inflation, interest rates, bond yields and company valuations together rather than examining stock prices in isolation.
October 2026: What Current Economic Developments Mean for Market Cycles
Understanding stock market cycles also requires considering the latest economic information.
The IMF’s October 2026 World Economic Outlook projects global economic growth of 3.1% for 2026 and 3.4% for 2027. It projects global headline inflation of 4.7% in 2026 before easing to 4.1% in 2027.
The IMF highlights several downside risks, including geopolitical conflicts, trade tensions, fiscal vulnerabilities and the possibility of reassessment of artificial intelligence investment expectations.
Meanwhile, S&P Global Market Intelligence’s October 19, 2026 outlook describes resilient near-term growth momentum but identifies mounting inflation and financial-condition risks.
These forecasts illustrate an important point: different institutions can have different expectations about economic growth, inflation and interest rates.
For investors, this is not proof that markets are entering a particular cycle phase. It is a reminder to monitor economic data, company earnings, valuations and risk exposure.
Important: Economic forecasts are estimates, not guarantees. Investors should check the latest releases from their national statistical agencies and central banks before making decisions.
How to Invest During Different Stock Market Cycles
A disciplined investment strategy can help investors manage uncertainty across different market environments.
1. Investing During Accumulation
Investors can examine:
- Company balance sheets.
- Cash flow generation.
- Debt levels.
- Valuation ratios.
- Competitive advantages.
- Long-term business prospects.
Avoid assuming that a stock is undervalued simply because its price has fallen.
2. Investing During Expansion
During a bull market, investors should avoid becoming excessively confident.
Consider:
- Reviewing portfolio diversification.
- Monitoring valuation levels.
- Evaluating earnings growth.
- Maintaining an appropriate asset allocation.
- Avoiding excessive borrowing to invest.
3. Investing During Distribution
When valuations and speculation increase, investors can review portfolio concentration and risk exposure.
Consider whether individual holdings still match their original investment objectives.
Rebalancing may help maintain a suitable level of portfolio risk.
4. Investing During Mark-Down
During significant market declines:
- Avoid making decisions solely because of negative headlines.
- Review your emergency savings.
- Assess your investment time horizon.
- Check whether your original investment thesis remains valid.
- Avoid forced selling caused by excessive leverage.
Investors approaching retirement may need a different risk-management approach from younger investors with several decades remaining before retirement.
Important Investment Formulas for Understanding Market Cycles
1. Percentage Market Return
Return (%) = [(Ending Value − Beginning Value) / Beginning Value] × 100
Example:
An investor purchases an ETF for $100 and its market value increases to $120.
Return = [($120 − $100) / $100] × 100
Return = 20%.
This is a price return example and excludes dividends, taxes and transaction costs.
2. Compound Annual Growth Rate (CAGR)
CAGR = [(Ending Value / Beginning Value)^(1/n) − 1] × 100
Where n represents the number of years.
Example:
An investment grows from $10,000 to $15,000 over five years.
CAGR = [(15,000 / 10,000)^(1/5) − 1] × 100
CAGR is approximately 8.45%.
CAGR provides an annualized growth rate, but it does not mean the investment generated that exact return every year.
3. Maximum Drawdown
Maximum Drawdown = [(Trough Value − Peak Value) / Peak Value] × 100
Example:
A portfolio falls from $100,000 to $70,000.
Drawdown = [($70,000 − $100,000) / $100,000] × 100
Drawdown = −30%.
The investor needs a 42.86% gain from $70,000 to return to $100,000.
This illustrates why protecting against large losses can be important for long-term wealth creation.
Dollar-Cost Averaging During Market Cycles
Dollar-cost averaging (DCA) means investing a predetermined amount at regular intervals, regardless of short-term market prices.
For example, an investor contributes $500 monthly to a diversified index fund.
When prices are lower, the same contribution purchases more units. When prices are higher, it purchases fewer units.
Suppose an investor makes these contributions:
| Month | Investment | Unit price | Units purchased |
|---|---|---|---|
| January | $500 | $50 | 10 |
| February | $500 | $40 | 12.5 |
| March | $500 | $25 | 20 |
| April | $500 | $50 | 10 |
| Total | $2,000 | 52.5 |
Average purchase price:
$2,000 / 52.5 = approximately $38.10 per unit.
This example illustrates how regular investing can result in purchasing more units when prices are lower.
However, dollar-cost averaging does not guarantee profits or prevent losses. It may also underperform investing a lump sum immediately when markets rise consistently. Regular investing is only one part of a sound financial plan. Our guide to personal finance fundamentals covers the broader money-management principles that support long-term financial goals.
The Importance of Diversification Across Market Cycles
Diversification means spreading investments across different assets, companies, industries and geographical markets.
A diversified portfolio may contain:
- US equities.
- UK equities.
- Canadian equities.
- Australian equities.
- International ETFs.
- Government bonds.
- High-quality corporate bonds.
- Cash equivalents.
Diversification reduces exposure to individual investments and industries, but it cannot eliminate market risk.
For example, a portfolio concentrated entirely in technology stocks may experience substantial losses if technology valuations decline.
An internationally diversified portfolio may reduce dependence on one country’s economy, although global markets can still fall together during major financial crises.
Stock Market Cycles and Retirement Investing
Market cycles have a particularly important effect on retirement portfolios because investors may depend on their investments for future income.
Different countries have different retirement systems:
- United States: 401(k) plans and Individual Retirement Accounts (IRAs).
- United Kingdom: Individual Savings Accounts (ISAs) and workplace pensions.
- Canada: Registered Retirement Savings Plans (RRSPs) and Tax-Free Savings Accounts (TFSAs).
- Australia: Superannuation accounts.
Investors with long retirement horizons may be able to tolerate more short-term volatility than individuals who need to withdraw money soon.
However, retirement planning should consider both investment risk and withdrawal risk. For more detailed guidance, explore our retirement investment strategies guide, including how to think about asset allocation, time horizons and withdrawals during volatile markets.
What Is Sequence-of-Returns Risk?
Sequence-of-returns risk is the risk that the order of investment returns can negatively affect a portfolio when an investor is making withdrawals.
For example, a major market decline early in retirement can be particularly damaging if the investor must sell investments to meet living expenses.
Possible risk-management approaches include:
- Maintaining appropriate cash reserves.
- Diversifying across asset classes.
- Reviewing withdrawal rates.
- Rebalancing periodically.
- Matching investments with expected spending needs.
Common Mistakes Investors Make During Stock Market Cycles
1. Panic Selling
Selling investments during a temporary decline can turn an unrealized loss into a realized loss.
2. Chasing Market Hype
Purchasing stocks only because they are popular can lead to excessive valuations and poor investment decisions. For a foundation in investment risk and decision-making, readers can also consult the SEC’s Investor.gov investing education resources.
3. Ignoring Valuations
Even excellent companies can become risky investments when purchased at excessively high prices.
4. Overusing Leverage
Borrowing money to invest increases potential losses and can create forced selling during market downturns.
5. Attempting to Predict Every Market Top and Bottom
Market turning points are difficult to identify consistently, even for professional investors.
6. Ignoring Portfolio Rebalancing
A portfolio can gradually become more concentrated in one asset class after a prolonged bull market.
7. Confusing Economic Recovery With Market Recovery
Stock markets can recover before employment, consumer confidence and other economic indicators return to previous levels.
How to Recognize Changes in Stock Market Cycles
No single indicator can reliably identify every market turning point.
Instead, investors should examine multiple indicators together.
| Indicator | What it helps evaluate |
|---|---|
| Corporate earnings | Business profitability |
| Inflation | Changes in purchasing power |
| Interest rates | Cost of borrowing |
| Employment | Labour market strength |
| GDP | Overall economic activity |
| PMI | Business activity trends |
| Bond yields | Interest-rate expectations |
| Market valuations | Price relative to fundamentals |
| Credit spreads | Perceived credit risk |
Investors should also remember that economic statistics are sometimes revised and that market prices can react before official data become available.
Frequently Asked Questions About Stock Market Cycles
1. What are the four stages of stock market cycles?
The four commonly discussed stages are accumulation, mark-up, distribution and mark-down. They describe how markets can transition from pessimism and recovery to expansion, excessive optimism and eventual decline.
2. How long does a stock market cycle last?
There is no fixed duration. Some cycles develop over months, while others continue for several years. Their length depends on economic conditions, monetary policy, corporate earnings and investor behaviour.
3. What is the difference between a bull market and a bear market?
A bull market generally describes a sustained increase in stock prices, while a bear market typically describes a decline of 20% or more from a recent peak. Both can occur within broader economic and financial cycles.
4. Can investors make money during a bear market?
Yes, certain investment strategies may generate positive returns during declining markets. However, short selling, options and leveraged strategies involve significant risks. Long-term investors may instead focus on diversification, suitable asset allocation and disciplined contributions.
5. What causes stock market cycles?
Stock market cycles are influenced by interest rates, inflation, company earnings, economic growth, government policy, geopolitical developments, liquidity and investor psychology.
6. Is it possible to predict stock market cycles?
It is possible to monitor indicators and identify changing economic conditions, but accurately predicting market peaks and bottoms is extremely difficult. Investors should avoid treating forecasts as certainties.
7. What is the best investment strategy during a market crash?
There is no universally suitable strategy. Investors should evaluate their financial goals, time horizon, emergency savings, diversification and risk tolerance. Avoid making decisions solely because of market panic.
8. How do interest rates affect stock market cycles?
Interest rates influence borrowing costs, consumer spending, corporate investment and the discount rates used to value future earnings. Higher rates can pressure some equity valuations, while lower rates can support investment. The overall effect depends on economic conditions.
9. Do stock market cycles affect ETFs and index funds?
Yes. ETFs and index funds that hold equities are exposed to market fluctuations. Broadly diversified funds can reduce company-specific risk, but they cannot eliminate market-wide declines.
10. Are stock market cycles the same in the US, UK, Canada and Australia?
No. Each country has different economic conditions, industries, central bank policies, currencies and market structures. However, international markets are connected through trade, investment flows, interest rates and global financial conditions.
11. What is the difference between a market correction and a bear market?
A correction is commonly defined as a decline of approximately 10% from a recent high. A bear market is commonly defined as a decline of 20% or more. These are market conventions rather than universal legal definitions.
12. Should beginners invest during a stock market downturn?
Beginners should first establish an emergency fund, understand investment risks and choose investments that match their financial goals. Regular investing in diversified funds may be appropriate for some long-term investors, but no investment approach guarantees profits.
Final Thoughts: Understanding Stock Market Cycles for Long-Term Wealth
Stock market cycles are a normal part of financial markets. They reflect changing economic conditions, corporate performance, investor expectations and human behaviour.
The four major stages – accumulation, mark-up, distribution and mark-down – provide a useful framework for understanding market movements.
Historical events such as the Dot-Com Bubble, the 2008 Global Financial Crisis, the COVID-19 crash and the 2022 inflation shock demonstrate that markets can experience very different types of expansion and decline.
However, history does not guarantee that future market cycles will follow the same pattern.
Successful long-term investing requires more than identifying market phases. Investors should understand company fundamentals, monitor valuations, maintain diversification, manage risk and avoid emotional decisions.
Rather than attempting to predict every market movement, focus on building a disciplined investment strategy that can withstand different economic environments.
The most important lesson is simple: understand the cycle, manage your risk and keep your long-term financial objectives in focus.
Educational Disclaimer
This article is intended for educational and informational purposes only. It does not constitute personalized investment, financial, tax or legal advice. Stocks, ETFs, bonds and other investments involve risks, including the possible loss of principal. Past market performance and historical case studies do not guarantee future results. Readers should conduct independent research and consult an appropriately qualified financial professional when necessary.