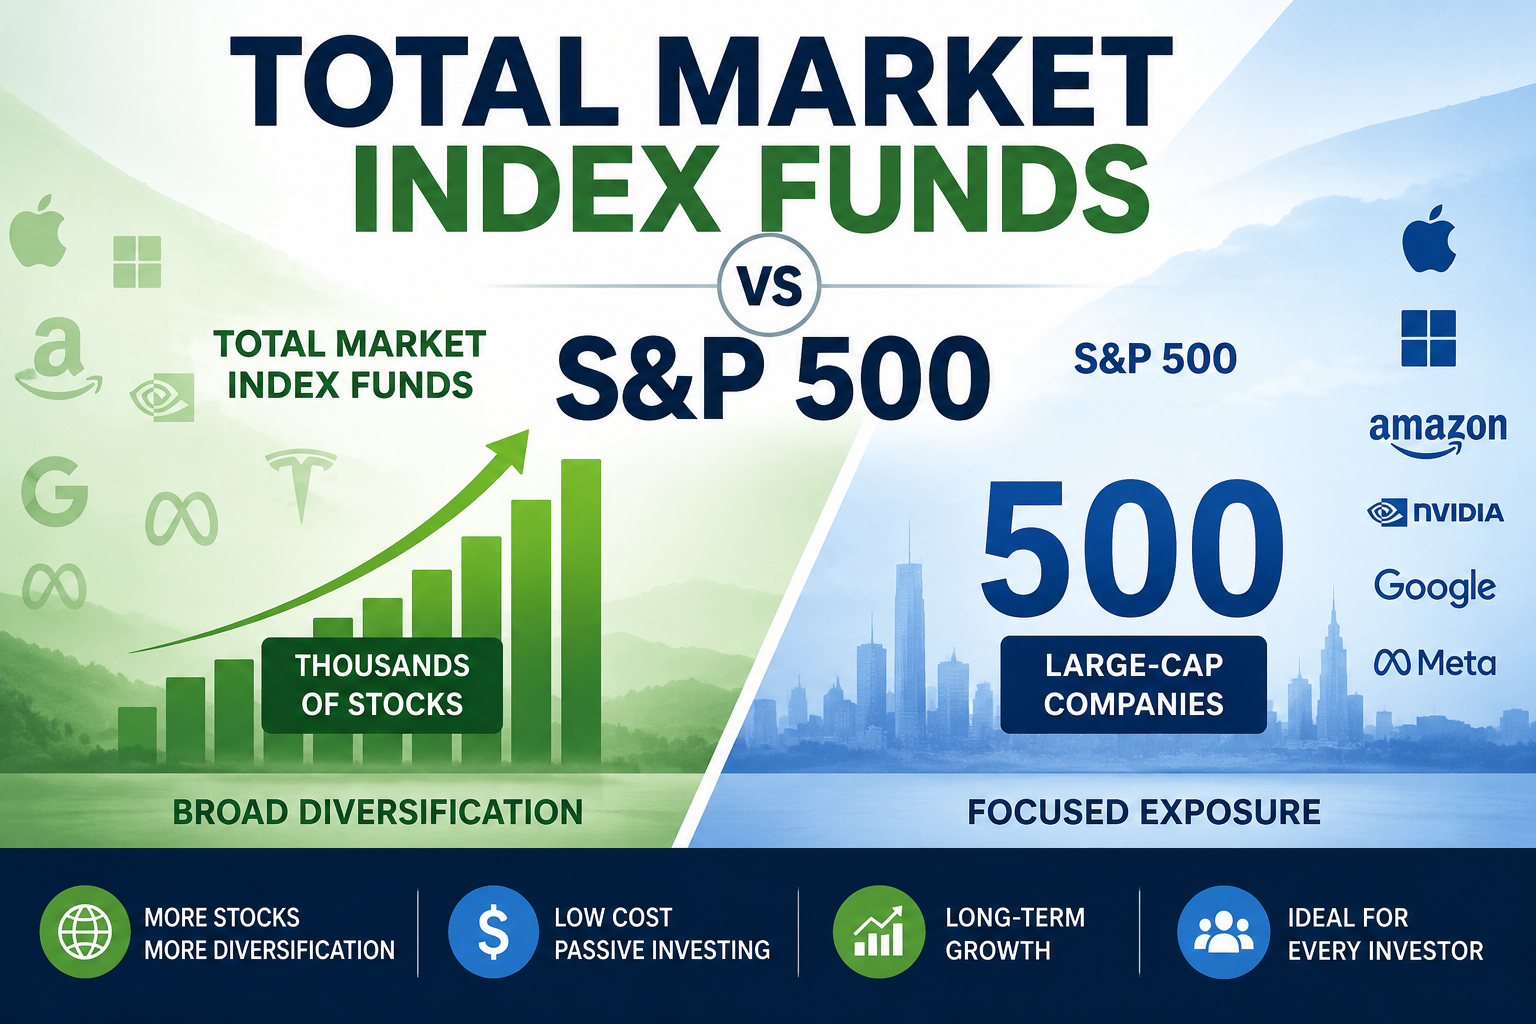
Introduction: Total Market Index Funds vs S&P 500
Total Market Index Funds vs S&P 500 is an important comparison for investors who want to build long-term wealth through the stock market. Both investment approaches provide exposure to American businesses, offer relatively low-cost investing options, and allow investors to participate in the growth of publicly traded companies without selecting individual stocks.
Investors who are still learning the fundamentals should first understand the Beginner’s Guide to Investing before choosing an investment strategy. Understanding Total Market Index Funds vs S&P 500 is particularly important because the two strategies provide different levels of exposure to large-cap, mid-cap, and small-cap companies.
However, they are not identical.
A total stock market index fund attempts to represent a broad range of the investable U.S. stock market, including large-cap, mid-cap, small-cap, and sometimes micro-cap companies. To understand how these companies are traded and how investors participate in the market, read our guide to What Is the Stock Market?. An S&P 500 index fund, on the other hand, tracks approximately 500 leading large-cap U.S. companies selected according to the index provider’s eligibility and committee methodology.
For example, the Vanguard Total Stock Market ETF (VTI) follows the CRSP US Total Market Index, while the Vanguard S&P 500 ETF (VOO) follows the S&P 500 Index.
Both can serve as core holdings in a long-term investment portfolio. Nevertheless, their differences in market coverage, company size exposure, concentration, historical performance, and portfolio construction can influence an investor’s decision.
Consider two investors:
- Investor A invests $10,000 in a total stock market ETF to obtain broad exposure to U.S. businesses.
- Investor B invests $10,000 in an S&P 500 ETF to concentrate on established large-cap companies.
Neither strategy guarantees higher returns. Their results depend on company performance, market conditions, valuations, economic growth, investment costs, and the period being examined. This is the central distinction in Total Market Index Funds vs S&P 500: one approach seeks broader U.S. market coverage, while the other focuses on leading large-cap companies.
This comprehensive guide explains both strategies, their terminology, advantages, disadvantages, historical market examples, investment calculations, and practical portfolio applications.
Important: This article is educational and does not provide individualized financial advice. Fund data, expenses, tax treatment, and investment availability can change. Always review the latest prospectus and official fund documents before investing.
What Is a Total Market Index Fund?
A total market index fund is an investment fund designed to track a broad index representing a large portion of the investable stock market. Learn more about the different fund structures, investment approaches, and passive investing options in our guide to ETFs and Index Funds.
Instead of investing in only a limited group of large companies, it attempts to include businesses across multiple market-capitalization categories.
These categories include:
- Large-cap companies
- Mid-cap companies
- Small-cap companies
- Micro-cap companies, where included by the benchmark
Index: A measurement system that tracks the performance of a selected group of securities.
Index fund: A mutual fund or exchange-traded fund (ETF) that attempts to replicate the performance of an index.
Total market: A broad collection of eligible securities representing the investable stock market, rather than literally every company or security in existence.
For example, the CRSP US Total Market Index is designed to represent the entire investable U.S. equity market. Its methodology includes eligibility rules, investability screens, market-capitalization segments, and periodic index reconstitution. You can learn more about the benchmark’s eligibility requirements, market-capitalization segments, and index construction in the official CRSP Market Indexes Methodology Guide.
How Does a Total Market Index Fund Work?
Suppose an investor wants exposure to thousands of U.S. companies.
Buying individual shares in every company would be expensive, complicated, and difficult to maintain.
A total market ETF simplifies the process by holding a portfolio designed to follow a broad-market benchmark.
The fund generally uses market-capitalization weighting.
This means companies with larger market values receive larger portfolio weights, while smaller companies receive smaller weights.
For example:
| Company category | Illustrative portfolio weight |
|---|---|
| Large-cap companies | 75% |
| Mid-cap companies | 18% |
| Small-cap companies | 6% |
| Micro-cap companies | 1% |
| Total | 100% |
These percentages are hypothetical, not the current allocation of VTI.
What Are the Main Benefits?
- Broader exposure to different company sizes.
- Participation in the growth of smaller businesses.
- Reduced dependence on a single large-company segment.
- Convenient access to a broad U.S. equity portfolio.
- Low-cost passive investment options.
However, holding more companies does not eliminate stock market risk. A broad U.S. equity fund can still fall substantially during a nationwide recession or financial crisis.
What Is an S&P 500 Index Fund?
The S&P 500 is a stock market index designed to measure the performance of the large-cap segment of the U.S. equity market.
It contains approximately 500 leading companies selected under the index provider’s methodology.
These companies represent different industries, including:
- Information technology
- Financial services
- Healthcare
- Consumer discretionary
- Consumer staples
- Industrials
- Energy
- Utilities
- Materials
- Communication services
- Real estate
The S&P 500 is widely used as a benchmark for U.S. large-cap equities.
A benchmark is a standard against which investment performance is measured.
For example, a U.S. large-cap fund manager may compare the fund’s annual return with the S&P 500 to evaluate whether the investment strategy has added value.
The index is float-adjusted market-capitalization weighted. This means a company’s influence depends on its eligible shares available for public trading and its market value.
For additional information about index construction, constituent eligibility, and weighting rules, consult the official S&P U.S. Indices Methodology.
How Does an S&P 500 Index Fund Work?
An S&P 500 ETF purchases shares in companies represented in the benchmark, using either full replication or an appropriate sampling approach.
For example, VOO attempts to track the S&P 500.
If the index’s largest companies represent substantial portions of its market capitalization, those companies also receive relatively large weights in the fund.
This is why a portfolio containing hundreds of companies can still have considerable exposure to a relatively small number of mega-cap businesses.
Why Do Investors Choose the S&P 500?
Investors commonly select S&P 500 funds because they offer:
- Exposure to established large-cap businesses.
- A recognizable performance benchmark.
- Broad sector representation.
- Convenient access through brokerage and retirement accounts.
- Relatively low-cost investment options.
- A straightforward approach to U.S. large-cap investing.
However, the S&P 500 is not the entire U.S. stock market. It does not provide the same direct mid-cap and small-cap exposure as a total market index.
Total Market Index Funds vs S&P 500: Key Differences
A closer look at Total Market Index Funds vs S&P 500 reveals differences in market capitalization, company exposure, diversification, and portfolio concentration. These factors can influence how each fund behaves across different economic and market cycles.
The biggest difference is market coverage.
A total market fund includes a much broader range of company sizes, whereas an S&P 500 fund focuses on large-cap businesses.
| Feature | Total Market Index Fund | S&P 500 Index Fund |
|---|---|---|
| Market coverage | Broad U.S. investable market | U.S. large-cap market |
| Company exposure | Large, mid and small companies | Approximately 500 constituent companies |
| Small-cap exposure | Yes | No direct small-cap exposure |
| Mid-cap exposure | Yes | No dedicated mid-cap exposure |
| Large-cap exposure | Yes | Yes |
| Diversification by company size | Broader | More concentrated in large caps |
| Market-cap weighting | Common | Float-adjusted market-cap weighted |
| Investment approach | Passive | Passive |
| Risk | Equity market risk | Equity market risk |
| Suitable for | Broad U.S. market exposure | Large-cap U.S. exposure |
Neither approach is automatically superior.
The right choice depends on what an investor wants to own, how the portfolio is structured, and whether other funds already provide exposure to different company sizes. A well-designed Portfolio Strategy considers asset allocation, investment objectives, risk tolerance, and the role each fund plays in the overall portfolio.
Understanding Market Capitalization
Market capitalization, commonly called market cap, represents the total market value of a company’s outstanding equity shares.
It is an important concept because both total market and S&P 500 indexes use market capitalization to determine company weights.
Market Capitalization Formula
Market Capitalization = Share Price × Total Outstanding Shares
For example:
Suppose a company has:
- Share price: $100
- Outstanding shares: 50 million
Calculation:
Market capitalization = $100 × 50,000,000
Market capitalization = $5 billion.
The company has a market value of $5 billion.
The following categories are illustrative rather than universal classification rules:
| Company category | Illustrative market capitalization |
|---|---|
| Mega-cap | Above $200 billion |
| Large-cap | $10 billion–$200 billion |
| Mid-cap | $2 billion–$10 billion |
| Small-cap | $300 million–$2 billion |
| Micro-cap | Below $300 million |
Classification thresholds change over time and differ between research providers.
Why Market Capitalization Matters
Imagine a total market index containing two companies:
- Company A has a market capitalization of $1 trillion.
- Company B has a market capitalization of $10 billion.
Company A has 100 times the market capitalization of Company B.
In a simplified market-cap-weighted portfolio, Company A would receive approximately 100 times the weight of Company B.
Therefore, owning thousands of companies does not mean investing equally in thousands of businesses.
The largest companies can still determine much of the fund’s performance.
Total Market Index Funds vs S&P 500: VTI vs VOO
VTI and VOO are two widely recognized Vanguard ETFs that provide different forms of U.S. equity exposure. This VTI vs VOO comparison is one of the most practical ways to understand Total Market Index Funds vs S&P 500 because each ETF follows a different benchmark.
Vanguard Total Stock Market ETF (VTI)
VTI seeks to track the CRSP US Total Market Index.
Its investment approach covers large-, mid-, small-, and micro-cap segments represented by its benchmark.
Its main characteristics include:
- Broad U.S. equity exposure.
- Market-cap-weighted portfolio construction.
- Passive index-tracking strategy.
- Exposure to companies of different sizes.
- Low ongoing fund expenses.
Vanguard’s published ETF information showed a 0.03% expense ratio for VTI in its November 5, 2026 fund listing. Investors can verify the current expense ratio, portfolio holdings, performance,returns, fees, distributions, and investment objective on Vanguard’s official VTI fund page.
Vanguard S&P 500 ETF (VOO)
VOO seeks to track the S&P 500 Index. VTI and VOO are not interchangeable benchmarks. VTI follows a broad U.S. equity market index, while VOO follows a large-cap index. Their substantial holdings overlap explains why their returns can be similar, but their exposure to smaller companies is different. For current holdings, fees, performance, distributions, and the fund prospectus, visit Vanguard’s official VOO fund page.
Its portfolio focuses on large-cap U.S. companies.
Its characteristics include:
- Exposure to approximately 500 index constituents.
- Large-cap U.S. stock allocation.
- Market-cap-weighted construction.
- Broad representation across major industries.
- Passive investment strategy.
VTI vs VOO: Which Is Better?
VTI may be more appropriate for someone who wants broad U.S. market exposure through a single equity fund.
VOO may be more appropriate for someone who deliberately wants exposure to large-cap U.S. businesses.
Both funds can be reasonable long-term investment building blocks.
The key is to select the exposure that matches the overall portfolio rather than choosing a fund simply because it performed better over the most recent year.
Expense Ratios and Investment Costs
An expense ratio represents the annual operating expenses charged by a fund, expressed as a percentage of its assets.
It is important because fees reduce the amount of investment return retained by shareholders.
Expense Ratio Formula
Annual Fund Expense = Investment Amount × Expense Ratio
Suppose an investor holds $10,000 in an ETF with a 0.03% expense ratio.
Calculation:
$10,000 × 0.0003 = $3 per year.
The estimated annual operating expense is $3, assuming the investment value remains unchanged.
VTI, VOO, IVV and SPY Comparison
The following figures are based on fund information available around November 2026. Confirm the latest prospectuses before publication or investment.
| ETF | Investment exposure | Published expense ratio |
|---|---|---|
| VTI | Total U.S. stock market | 0.03% |
| VOO | S&P 500 | 0.03% |
| IVV | S&P 500 | 0.03% |
| SPY | S&P 500 | 0.0945% |
Official fund information:
- Vanguard Total Stock Market ETF (VTI)
- Vanguard S&P 500 ETF (VOO)
- iShares Core S&P 500 ETF (IVV)
- State Street SPDR S&P 500 ETF Trust (SPY)
Expense ratios and fund characteristics can change. Check each provider’s latest fund documents before investing.
SPY is structured as an investment trust and is widely used for trading and options activity. IVV and VOO are common long-term investment alternatives.
Why Small Fee Differences Matter
Consider two hypothetical investments of $20,000:
- Fund A charges 0.03%.
- Fund B charges 0.50%.
Annual estimated fees:
Fund A = $20,000 × 0.0003 = $6.
Fund B = $20,000 × 0.005 = $100.
Difference = $94 annually.
Over several decades, recurring costs can make a meaningful difference, particularly when combined with compounding. To understand how investment returns can accumulate over time, read our detailed guide to Compound Interest.
Remember that expense ratios are not the only costs. Brokerage commissions, bid-ask spreads, taxes, and transaction costs can also affect investor returns.
Diversification: Which Fund Provides Better Exposure?
Diversification means spreading investments across different companies, industries, geographic markets, and asset classes to avoid excessive dependence on a single investment.
A total market index fund provides broader diversification across U.S. company sizes. For a deeper explanation of how investors spread risk across investments, explore our guide to Portfolio Diversification.
An S&P 500 fund provides diversification across many large-cap companies and sectors.
However, neither automatically creates a globally diversified portfolio.
Company Diversification
A total market fund includes smaller companies that are not represented in the S&P 500.
This provides additional exposure to businesses at different stages of development.
However, smaller companies can experience greater volatility, limited access to capital, and more sensitivity to economic conditions.
Sector Diversification
Both approaches provide exposure to multiple industries.
However, market-cap weighting means that sectors containing the largest companies can dominate portfolio performance.
A fund holding hundreds or thousands of companies can still have substantial concentration in technology-related businesses.
Geographic Diversification
VTI and VOO primarily provide U.S. equity exposure.
An investor who wants global diversification may also consider international stock funds.
For example, a portfolio could combine:
- U.S. total market equities.
- Developed international equities.
- Emerging market equities.
- Bonds.
- Cash reserves.
This can reduce reliance on the economic performance of one country, although diversification cannot eliminate losses.
Research Methodology: This comparison examines the index objectives, market coverage, fund expenses, diversification characteristics, and historical market behavior of total stock market and S&P 500 investment strategies. Fund information should be verified against the latest official prospectuses and provider disclosures. Historical performance comparisons should use identical measurement periods and consistent total-return methodologies.
Historical Performance: Which Has Delivered Better Returns?
Historical performance is one of the most frequently discussed differences between total market and S&P 500 funds. Understanding how long-term investing supports Wealth Building can help investors look beyond short-term market performance.
However, it is important to compare equivalent periods, reinvested dividends, fund expenses, and the same return measurement. When evaluating Total Market Index Funds vs S&P 500, investors should compare total returns over identical periods rather than relying on recent performance alone.
Why the S&P 500 Can Outperform
During periods when large-cap companies outperform mid-cap and small-cap businesses, S&P 500 funds may produce stronger returns than total market funds.
For example, the S&P 500 outperformed the S&P MidCap 400 and S&P SmallCap 600 benchmarks during 2025.
This illustrates how a market environment dominated by large companies can favor large-cap exposure.
Why Total Market Funds Can Outperform
During periods when smaller companies experience stronger growth than large-cap companies, total market funds can benefit from their additional exposure.
However, smaller companies do not outperform consistently.
Their returns depend on business growth, financing conditions, interest rates, valuations, and economic cycles.
The Importance of Total Return
Total return includes both changes in investment value and income received, such as dividends, assuming the relevant reinvestment convention is applied.
A price-only comparison can therefore produce an incomplete picture.
When comparing VTI and VOO, use their published total-return figures for identical dates.
Six Real-World Historical Case Studies
Historical events help explain why market coverage and company size exposure matter.
These examples describe actual market events, not guaranteed future investment outcomes.
Case Study 1: The Dot-Com Bubble (2000–2002)
During the late 1990s, investors became increasingly optimistic about internet and technology companies.
Many businesses received extremely high valuations despite limited profits or uncertain business models.
When the technology bubble burst, numerous technology stocks experienced substantial losses.
The event demonstrated the danger of paying excessive prices for companies based on unrealistic growth expectations.
Lesson: An index fund reduces dependence on an individual company, but market-cap weighting can still create substantial exposure to an overvalued sector or group of businesses.
Case Study 2: The Global Financial Crisis (2007–2009)
The global financial crisis involved problems in mortgage lending, housing markets, banking institutions, and credit markets.
Financial institutions experienced severe stress, and equity markets declined sharply.
Both broad-market and S&P 500 investors faced substantial losses.
The event demonstrated that diversification across companies cannot completely protect a portfolio against systemic economic shocks.
Lesson: Equity diversification is not a substitute for an appropriate allocation to bonds and other assets.
Case Study 3: The COVID-19 Market Crash (2020)
In early 2020, the COVID-19 pandemic created widespread economic uncertainty.
Business closures, travel restrictions, supply-chain disruption, and uncertainty about future earnings caused a rapid stock market decline.
Subsequently, major U.S. equity indexes recovered as economic activity resumed and monetary and fiscal support helped stabilize financial conditions.
Large technology and digital-platform businesses played an important role in the subsequent market recovery.
Lesson: The performance of market-cap-weighted indexes can be heavily influenced by the largest companies, particularly during periods of rapid technological change.
Case Study 4: The Inflation and Interest Rate Shock (2022)
In 2022, high inflation and aggressive interest rate increases created pressure on stock and bond valuations.
Growth-oriented businesses were particularly sensitive to changing expectations about future interest rates and earnings.
The experience showed that even established large-cap businesses can experience substantial declines.
Smaller businesses also faced financing and economic pressures.
Lesson: Neither VTI nor VOO should be treated as a guaranteed short-term savings vehicle.
Case Study 5: Large-Cap Leadership During 2025
The S&P Dow Jones Indices SPIVA U.S. Year-End 2025 report documented a strong year for U.S. large-cap equities.
The S&P 500 finished 2025 up approximately 18%, while 79% of active large-cap U.S. equity funds underperformed the benchmark.
The same report showed that the S&P 500 outperformed the S&P MidCap 400 by 10 percentage points and the S&P SmallCap 600 by 12 percentage points during 2025. These figures are reported in the S&P Dow Jones Indices SPIVA U.S. Year-End 2025 report, which examines the performance of actively managed funds against their benchmarks.
Important distinction: The 79% figure measures the percentage of actively managed large-cap U.S. equity funds that underperformed the S&P 500 during the 2025 calendar year. It does not measure the performance difference between VTI and VOO. The comparison between the S&P 500, S&P MidCap 400, and S&P SmallCap 600 also illustrates how large-cap stocks performed relative to mid-cap and small-cap stocks during that particular year. These results should not be interpreted as evidence that an S&P 500 ETF will always outperform a total market ETF.
This is an important real-world example of how large-cap leadership can influence the relative performance of the two investment approaches.
Lesson: A total market fund includes more company sizes, but broader coverage does not guarantee higher returns in every market cycle.
Case Study 6: Active Fund Performance and the Challenge of Beating the Benchmark
The SPIVA research program measures actively managed funds against appropriate market benchmarks.
Its June 30, 2026 U.S. data showed that 90.49% of active large-cap funds underperformed the S&P 500 over the preceding 15-year period. You can review the underlying data, methodology, and additional performance periods in the S&P Dow Jones Indices SPIVA research database.
Understanding the 15-Year SPIVA Statistic
The 90.49% figure represents a different measurement period from the 79% reported for 2025. It measures active large-cap fund underperformance over the 15 years ending June 30, 2026. In other words, it is a long-term comparison between actively managed large-cap funds and the S&P 500 benchmark, not a direct comparison of VTI and VOO.
These statistics provide evidence about the difficulty of consistently outperforming a market benchmark through active management. They do not establish which passive index fund will deliver better future returns. VTI and VOO track different indexes, and their relative performance depends on the performance of the companies and market-cap segments they hold.
This is not proof that every passive fund will outperform every active fund. It does, however, illustrate the difficulty of consistently selecting active managers who outperform after costs.
Lesson: Low costs, disciplined investing, and realistic expectations can be important components of a long-term investment strategy.
Portfolio Allocation: How Much Should You Invest?
Asset allocation is the process of dividing investments among asset classes such as stocks, bonds, and cash.
The appropriate allocation depends on investment objectives, time horizon, financial circumstances, and ability to tolerate losses. Investors building a retirement portfolio should also understand the principles of Retirement Investing, including withdrawal planning, time horizons, and risk management. The choice between Total Market Index Funds vs S&P 500 should therefore be considered within the context of the investor’s complete portfolio, not as an isolated fund-selection decision.
A young investor with a long time horizon may accept more equity volatility than someone approaching retirement.
Example 1: Growth-Oriented Portfolio
A hypothetical long-term portfolio could contain:
| Asset | Allocation |
|---|---|
| Total U.S. stock market | 60% |
| International equities | 25% |
| Bonds | 15% |
| Total | 100% |
This portfolio uses a broad U.S. market fund as its domestic equity foundation.
Example 2: Large-Cap-Oriented Portfolio
| Asset | Allocation |
|---|---|
| S&P 500 fund | 60% |
| International equities | 25% |
| Bonds | 15% |
| Total | 100% |
This approach gives greater emphasis to large-cap U.S. companies.
Neither allocation is universally appropriate.
Example 3: Combining VTI and VOO
An investor might consider:
| Asset | Allocation |
|---|---|
| VTI | 70% |
| VOO | 30% |
| Total | 100% |
However, VTI already contains substantial exposure to S&P 500 companies.
Therefore, adding VOO does not create an entirely separate diversification category. It increases the portfolio’s emphasis on large-cap stocks.
This is an important distinction when designing a portfolio.
Can You Own Both Total Market Index Funds and S&P 500 Funds?
Yes. Investors can own both funds in the same portfolio.
However, the decision should be based on the intended allocation rather than the assumption that combining them automatically doubles diversification.
VTI already includes many of the same large-cap companies represented in VOO.
Owning both therefore creates substantial overlap.
A combination may make sense when an investor deliberately wants a large-cap tilt.
A large-cap tilt means intentionally allocating more money to large companies than their existing weight in a broad-market index.
Investors should examine fund holdings and overlap before making this decision.
Risks of Total Market Index Funds and S&P 500 Funds
Both strategies involve equity market risk.
Market Risk
Market risk is the possibility that the overall stock market declines because of economic, financial, political, or geopolitical developments.
Both types of funds can lose value during a market downturn.
Concentration Risk
Concentration risk occurs when a portfolio depends heavily on a limited number of companies, sectors, or economic factors.
S&P 500 funds can have meaningful exposure to their largest constituents.
Total market funds also have concentration risk because they are generally market-cap weighted.
Small-Cap Risk
Smaller companies may have:
- Less financial flexibility.
- Greater sensitivity to borrowing costs.
- Lower trading liquidity.
- Less established business models.
- Greater earnings volatility.
Additional small-company exposure is not automatically an advantage.
Inflation Risk
Inflation reduces the purchasing power of money over time.
Although stocks may provide long-term growth opportunities, their returns are not guaranteed to exceed inflation over every investment period.
Behavioral Risk
Behavioral risk involves investment decisions influenced by fear, greed, overconfidence, and short-term market movements.
Selling during a downturn or constantly switching funds based on recent performance can damage long-term investment results.
Tax Efficiency and Account Considerations
Tax efficiency refers to how much investment return remains after applicable taxes. Investors outside the United States should not assume that a U.S.-listed ETF is automatically the most suitable option. Fund domicile, tax residency, withholding taxes, reporting obligations, currency conversion, and local investment regulations can affect the final outcome.
The treatment of ETF distributions, capital gains, dividends, and foreign investments differs across countries and account types. These decisions are part of broader Personal Finance planning, which includes taxes, savings, debt management, and investment goals.
United States
Investors may hold eligible funds in taxable brokerage accounts, traditional IRAs, Roth IRAs, and employer-sponsored retirement plans.
Tax consequences depend on the account, distribution type, holding period, and individual circumstances.
United Kingdom
U.K. investors should distinguish U.S.-listed ETFs from U.K.-domiciled or Ireland-domiciled UCITS funds.
ISA and pension eligibility, withholding taxes, reporting requirements, and currency exposure should be checked before investing.
Canada
Canadian investors should examine Canadian-listed alternatives, U.S.-listed ETF holdings, foreign withholding taxes, registered accounts, and currency conversion costs.
Australia
Australian investors should review local fund structures, brokerage access, distributions, capital gains tax, and applicable superannuation rules.
Important: U.S.-listed VTI and VOO are not automatically suitable or tax-efficient for every international investor. Local regulations and product availability matter.
Total Market Index Funds vs S&P 500 for Beginners
For beginners, simplicity is often more useful than attempting to predict which segment of the stock market will outperform.
Before choosing between these approaches, understand:
- Your investment time horizon.
- Your emergency savings.
- Your ability to tolerate market declines.
- Your existing retirement and investment holdings.
- Your investment costs.
- Your tax situation.
- Your need for international diversification.
A beginner who wants broad U.S. equity exposure may prefer a total market fund.
A beginner who intentionally wants large-cap exposure may prefer an S&P 500 fund.
Neither should be confused with a complete financial plan. Investors also need to consider fixed income, cash reserves, debt, insurance, and financial goals.
Common Mistakes to Avoid
Mistake 1: Choosing Only by Recent Returns
A fund that outperformed during the last year may underperform during the next market cycle.
Mistake 2: Assuming More Holdings Mean No Risk
Holding thousands of companies does not prevent a broad stock market decline.
Mistake 3: Ignoring Fund Overlap
Combining VTI and VOO creates considerable overlap because VTI already owns many S&P 500 constituents.
Mistake 4: Ignoring Expenses
Small recurring costs can reduce long-term returns.
Mistake 5: Investing Money Needed Soon
Equity funds are generally unsuitable for money that must be available at a fixed near-term date.
Mistake 6: Confusing U.S. Diversification With Global Diversification
Owning many American companies does not automatically provide international market exposure.
How to Evaluate a Total Market or S&P 500 ETF
Before purchasing a fund, compare these characteristics, Our Market Guides provide additional explanations of investment terminology, market benchmarks, and financial concepts that can help investors evaluate their options:
| Evaluation factor | What to examine |
|---|---|
| Benchmark | Which index does the fund track? |
| Expense ratio | What are its annual operating expenses? |
| Holdings | Which companies are included? |
| Diversification | What are the company and sector weights? |
| Tracking difference | How closely does it follow its benchmark? |
| Liquidity | How actively does it trade? |
| Bid-ask spread | What is the typical trading cost? |
| Fund structure | ETF, mutual fund, or investment trust? |
| Tax treatment | What are the applicable local tax rules? |
| Investment objective | Does it match your financial plan? |
For additional investor education, the U.S. Securities and Exchange Commission’s Investor.gov guide to index funds explains how index funds work and discusses expenses, tracking differences, and investment risks.
Frequently Asked Questions (FAQs)
1. Are Total Market Index Funds Better Than the S&P 500?
Not necessarily. Total market funds provide broader exposure across company sizes, while S&P 500 funds focus on large-cap U.S. businesses. The better choice depends on the investor’s objectives and existing portfolio.
2. Which Is Better for Long-Term Investing: VTI or VOO?
Both can be suitable long-term equity investments. VTI provides broader U.S. market coverage, while VOO concentrates on the S&P 500. Neither guarantees superior future returns.
3. Does VTI Include the S&P 500?
VTI holds many of the companies represented in the S&P 500, alongside mid-cap and smaller companies. It is not identical to the S&P 500 index.
4. Why Do VTI and VOO Often Have Similar Returns?
Their portfolios overlap substantially because the largest U.S. companies represent significant portions of the total stock market. Their returns can therefore move similarly, although differences in smaller-company performance can affect the results.
5. Is VOO Riskier Than VTI?
Both carry stock market risk. VOO has greater concentration in large-cap companies, while VTI includes additional exposure to smaller businesses. Which experiences greater volatility depends on market conditions and the measurement period.
6. Should I Invest in Both VTI and VOO?
You can, but understand that their holdings overlap. Combining them generally increases large-cap exposure rather than providing completely separate diversification.
7. Which Fund Has More Diversification?
A total market fund generally offers broader diversification across company sizes. However, both funds can be concentrated in the largest companies because of market-cap weighting.
8. Are Total Market Funds Good for Retirement?
They can be useful equity components of retirement portfolios. However, retirement portfolios also need to consider bonds, cash needs, withdrawals, investment horizon, and risk tolerance.
9. What Is the Difference Between VTI, VOO, IVV, and SPY?
VTI tracks a broad U.S. stock market benchmark. VOO, IVV, and SPY track the S&P 500. Their fees, structures, trading characteristics, and tax considerations differ.
10. Can I Lose Money Investing in an S&P 500 or Total Market ETF?
Yes. Both are stock investments and can decline substantially. Investors may lose part or all of their invested capital.
11. Does the S&P 500 Include Small-Cap Stocks?
No. The S&P 500 measures the large-cap segment of the U.S. equity market. It does not provide dedicated small-cap exposure.
12. Do Total Market Funds Pay Dividends?
Yes. Eligible companies in their portfolios may distribute dividends, which the fund generally passes to shareholders after applicable expenses and withholding. Distribution amounts vary.
13. Is VTI More Diversified Than VOO?
VTI generally includes more companies and a wider range of company sizes. However, it still has substantial exposure to the largest U.S. companies.
14. Should Beginners Invest in Index Funds?
Low-cost index funds can be useful for beginners because they provide diversified market exposure without requiring individual stock selection. Beginners should still understand market risk, costs, and asset allocation.
15. Is an S&P 500 Fund Enough for a Diversified Portfolio?
It may provide broad exposure to large-cap U.S. stocks, but it does not independently provide bonds, international equities, or dedicated small-cap exposure. Whether additional investments are appropriate depends on the investor’s objectives.
Final Verdict: Total Market Index Funds vs S&P 500
Total Market Index Funds vs S&P 500 is not a question of finding one universally superior investment. It is about understanding which type of U.S. stock market exposure belongs in a long-term financial strategy. It is about understanding which type of market exposure belongs in a long-term financial strategy.
A total market index fund provides exposure to large-, mid-, and small-cap U.S. companies. It is suitable for investors who want broad domestic equity coverage through one investment.
An S&P 500 index fund provides exposure to established large-cap U.S. businesses. It is suitable for investors who intentionally want to track the large-cap segment of the American stock market.
For investors comparing VTI and VOO, both are established low-cost investment options, but they represent different benchmarks.
The most important principles are to diversify appropriately, control costs, understand risk, avoid unnecessary trading, and maintain a disciplined investment strategy.
The best fund is not necessarily the one that performed best last year. It is the one whose investment exposure, costs, risks, and structure fit your long-term financial plan.
Sources and Further Reading
The following official resources provide additional information about index construction, fund expenses, investment risks, and historical performance research.
- Vanguard — Total Stock Market ETF (VTI): Official VTI fund information — Review the fund’s investment objective, holdings, expense ratio, performance, and prospectus.
- Vanguard — S&P 500 ETF (VOO): Official VOO fund information — Review the fund’s benchmark, holdings, expenses, distributions, and historical returns.
- S&P Dow Jones Indices – S&P U.S. Indices Methodology: Official methodology — Understand index construction, eligibility requirements, and market-cap weighting.
- CRSP – Market Indexes Methodology Guide: Official methodology guide — Learn how the CRSP U.S. Total Market Index is constructed and maintained.
- S&P Dow Jones Indices – SPIVA Research: SPIVA research and performance scorecards — Explore research comparing actively managed funds with their benchmarks, including the 2025 and June 2026 findings discussed in this article.
- iShares – Core S&P 500 ETF (IVV): Official IVV fund information — Review its investment objective, costs, holdings, and performance.
- State Street – SPDR S&P 500 ETF Trust (SPY): Official SPY fund information — Review its structure, benchmark, expenses, and fund information.
- U.S. Securities and Exchange Commission – Index Funds: Investor.gov index fund guide — Understand index funds, expenses, tracking differences, and investment risks.
- S&P Dow Jones Indices – SPIVA U.S. Year-End 2025
Editorial disclaimer: TheAJTimes.com provides financial education and general investment information. This article is not individualized financial, tax, or legal advice. Past performance does not guarantee future results.