Introduction: Why the PE Ratio Explained Is One of the Most Famous Investing Metrics
In the world of investing, PE Ratio Explained is one of the most searched financial concepts among beginners and professional investors. Understanding the PE Ratio Explained properly can help investors evaluate whether a stock is expensive, undervalued, or fairly priced. One of the most widely used and widely misunderstood metrics is the Price-to-Earnings ratio, commonly known as the PE Ratio.
If you have ever searched for a company on financial websites like Yahoo Finance, Morningstar, or Bloomberg, you probably noticed a number labeled P/E next to the stock price. Investors frequently use this number to determine whether a stock is cheap, expensive, or fairly valued.
However, the reality is more nuanced.
Many beginners assume a low P/E means a stock is cheap and a high P/E means a stock is expensive. While that can sometimes be true, it is often misleading. Some of the best companies in history have always traded at high PE ratios, while many struggling businesses appear “cheap” with extremely low PE ratios.
Understanding when the PE ratio matters and when it doesn’t is critical for making intelligent investment decisions.
This guide will explain:
- What the PE ratio explained actually means
- How the formula works
- The types of PE ratios investors use
- How to interpret P/E ratios in different industries
- When the PE ratio is useful
- When the PE ratio becomes misleading
- Real-world case studies from major global companies
By the end of this article, you will know how professional investors actually use the P/E ratio.
Why the PE Ratio Matters for Investors
The PE Ratio (Price-to-Earnings Ratio) is one of the most widely used metrics in stock market analysis. Investors use the PE Ratio to evaluate whether a stock is expensive or cheap relative to its earnings. By comparing the PE Ratio across companies and industries, investors can better understand market expectations and potential growth opportunities.
Because the price-to-earnings ratio connects stock price with company profits, it provides a quick snapshot of how the market values a company’s earnings power.
What Is the PE Ratio in Stock Market Investing?
The P/E Ratio (Price-to-Earnings Ratio) is one of the most widely used valuation metrics in stock market investing. Investors use the price-to-earnings ratio to determine whether a stock is overvalued, undervalued, or fairly priced. Understanding how the P/E Ratio works can help investors make better long-term investment decisions and compare companies across different industries.
PE Ratio Explained: What the Price-to-Earnings Ratio Means
The P/E Ratio (Price-to-Earnings Ratio) is one of the most widely used metrics in stock market investing. It measures how much investors are willing to pay for each dollar of a company’s earnings.
In simple terms, the P/E Ratio connects a company’s stock price with its profits, helping investors evaluate whether a stock may be overvalued, undervalued, or fairly priced.
For example, if a company has a PE Ratio of 20, investors are paying $20 for every $1 of earnings the company generates. This metric is widely used by analysts and institutional investors when evaluating companies in major indexes such as the S&P 500.
Because the P/E Ratio reflects both market expectations and company profitability, it has become one of the most important tools in modern stock valuation.
1. PE Ratio Explained: Meaning, Formula and Example
The Price-to-Earnings (PE) ratio measures how much investors are willing to pay for $1 of a company’s earnings.
In simple terms:
P/E Ratio = Price investors pay ÷ Profit the company generates
It answers a simple question:
How expensive is this company’s stock compared to its profits?
Example
Imagine a company with:
- Stock price: $100
- Earnings per share (EPS): $5
The P/E ratio would be:
P/E = 100 ÷ 5 = 20
This means investors are paying $20 for every $1 of earnings the company produces.
P/E Ratio Formula (Price-to-Earnings Ratio Explained)
The Price-to-Earnings Ratio (earnings multiple) is one of the most important valuation metrics investors use to evaluate whether a stock is expensive, cheap, or fairly valued.
It shows how much investors are willing to pay for $1 of a company’s earnings.
P/E Ratio Formula
The formula for calculating the P/E Ratio is:
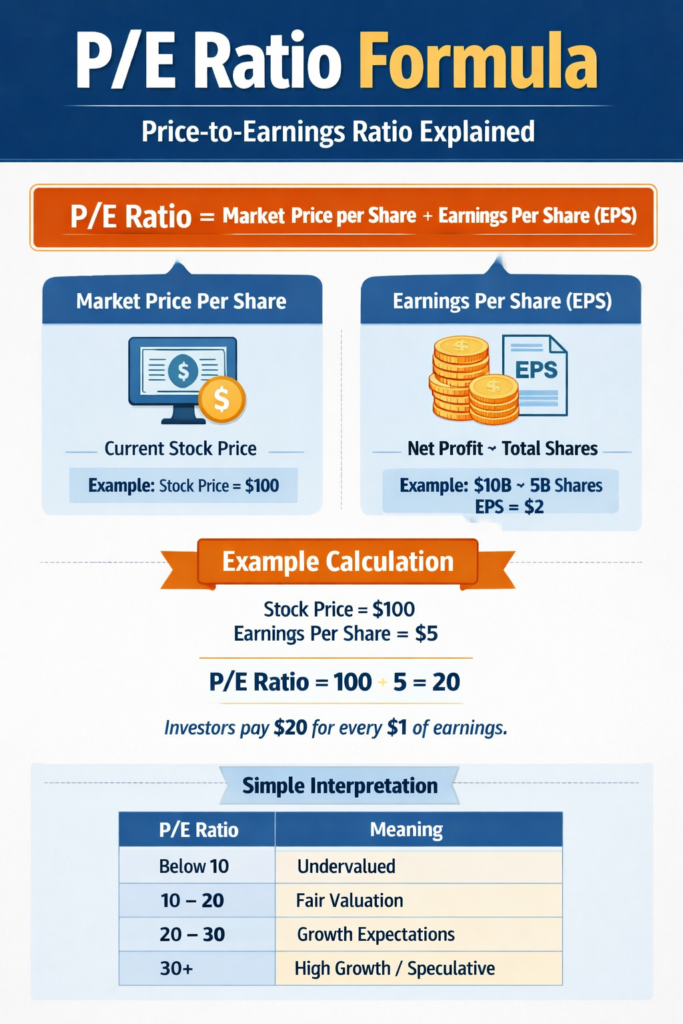
P/E Ratio = Market Price per Share ÷ Earnings per Share (EPS)
Components of the Formula
1. Market Price per Share
This is the current trading price of the stock in the market.
Example:
- Stock price = $100
The price changes throughout the trading day as investors buy and sell shares.
2. Earnings Per Share (EPS)
Earnings Per Share represents how much profit a company earns per share.
EPS Formula:EPS = Net Profit ÷ Total Shares Outstanding
Example:
- Net profit = $10 billion
- Total shares = 5 billion
EPS=10B÷5B=2
So the company earns $2 per share.
Example: P/E Ratio Calculation
Assume a company has:
- Stock Price = $100
- Earnings Per Share (EPS) = $5
Now calculate the P/E Ratio.P/E=100÷5P/E=20
Interpretation
A P/E Ratio of 20 means:
Investors are willing to pay $20 for every $1 of earnings the company generates.
Simple Interpretation of the P/E Ratio
| P/E Ratio | Meaning |
|---|---|
| Below 10 | Possibly undervalued or struggling company |
| 10 – 20 | Fair valuation |
| 20 – 30 | Growth expectations |
| 30+ | High-growth company or speculative valuation |
However, the interpretation depends on:
- industry
- growth rate
- economic conditions
- interest rates
Why Investors Use the P/E Ratio in Stock Market Investing
Investors use the earnings multiple to:
• Compare companies in the same industry
• Identify undervalued stocks
• Evaluate growth expectations
• Understand market valuation
For example:
Two companies in the same industry:
| Company | Stock Price | EPS | P/E |
|---|---|---|---|
| Company A | $100 | $5 | 20 |
| Company B | $100 | $10 | 10 |
Company B has a lower earnings multiple, which may indicate the stock is cheaper relative to its earnings.
Key Takeaway
The earnings multiple (Price-to-Earnings Ratio) is calculated by dividing a company’s stock price by its earnings per share (EPS). It helps investors understand how much they are paying for a company’s profits and is one of the most widely used metrics in stock market investing.
The PE Ratio (Price-to-Earnings Ratio) measures how much investors pay for $1 of a company’s earnings. It is calculated as Stock Price ÷ Earnings Per Share (EPS).
P/E Ratio Explained (Video Guide)
Watch this simple explanation of how the PE Ratio works in stock valuation and how investors use it to evaluate stocks.
This short video explains:
• What the Price-to-Earnings Ratio means
• How to calculate the earnings multiple
• How investors use the metric to value stocks
Videos improve understanding and make financial concepts easier to learn for beginner investors.
2. PE Ratio Explained: How to Calculate the P/E Ratio Formula
The standard formula is:
P/E Ratio = Market Price per Share ÷ Earnings per Share (EPS)
Let’s break this down.
Market Price Per Share
This is the current stock price in the market.
Example:
- Apple stock price: $200
- Microsoft stock price: $400
The market price constantly changes because investors buy and sell shares throughout the day.
Earnings Per Share (EPS)
EPS represents how much profit the company generates per share of stock.
Formula:
EPS = Net Profit ÷ Total Shares Outstanding
Example:
If a company earns $10 billion in profit and has 5 billion shares, then:
EPS = 10B ÷ 5B = $2 per share
Example Calculation
Company A:
- Share price = $50
- EPS = $2
P/E = 50 ÷ 2 = 25
This means investors are willing to pay 25 times the company’s annual profit.
3. Why Investors Use the P/E Ratio
To fully understand PE Ratio Explained, investors must know why this metric is widely used in stock market valuation. The concept of PE Ratio Explained helps investors compare company earnings with stock price. The P/E ratio helps investors answer several important questions:
1. Is a stock expensive?
A higher P/E might suggest investors expect future growth.
2. Is a stock undervalued?
A lower P/E might indicate a stock is cheap relative to earnings.
3. How does this company compare to competitors?
Investors often compare P/E ratios within the same industry.
4. Is the overall market expensive?
The P/E ratio can also be used for stock indexes like the S&P 500.
4. Types of PE Ratios Investors Use
There is not just one P/E ratio. Professional investors use several variations.
1. Trailing P/E (Historical P/E)
Trailing P/E uses past earnings, usually from the last 12 months.
Formula:
Trailing P/E = Current Price ÷ Earnings from Last 12 Months
Advantages:
- Based on real financial data
- Reliable historical information
Disadvantages:
- Does not consider future growth
2. Forward P/E
Forward P/E uses expected future earnings.
Formula:
Forward P/E = Current Price ÷ Expected Future EPS
Analysts estimate future earnings using:
- Revenue growth projections
- Economic conditions
- Industry trends
Example:
Stock price = $100
Expected EPS next year = $10
Forward P/E = 10
Forward P/E helps investors determine whether a stock may become cheaper as earnings grow.
3. Shiller P/E (CAPE Ratio)
Another advanced version is the Cyclically Adjusted Price-to-Earnings ratio (CAPE) developed by economist Robert Shiller. i.e. The CAPE ratio was developed by Nobel Prize–winning economist Robert Shiller to evaluate long-term stock market valuations.
Instead of using one year of earnings, it averages 10 years of inflation-adjusted earnings.
Purpose:
- Remove short-term economic cycles
- Measure long-term market valuation
This metric is often used to evaluate whether the overall stock market is overvalued.
5. What Is a Good PE Ratio for Stocks?
There is no universal number that defines a good P/E ratio.
However, historically:
| P/E Ratio | Interpretation |
|---|---|
| Below 10 | Possibly undervalued or struggling company |
| 10–20 | Fair valuation |
| 20–30 | Growth expectations |
| 30+ | High growth or speculative |
But context is extremely important.
When discussing PE Ratio Explained, one of the most common questions investors ask is: What is considered a good P/E ratio?
For example:
- Technology companies often trade at high P/E ratios
- Utility companies usually have low P/E ratios
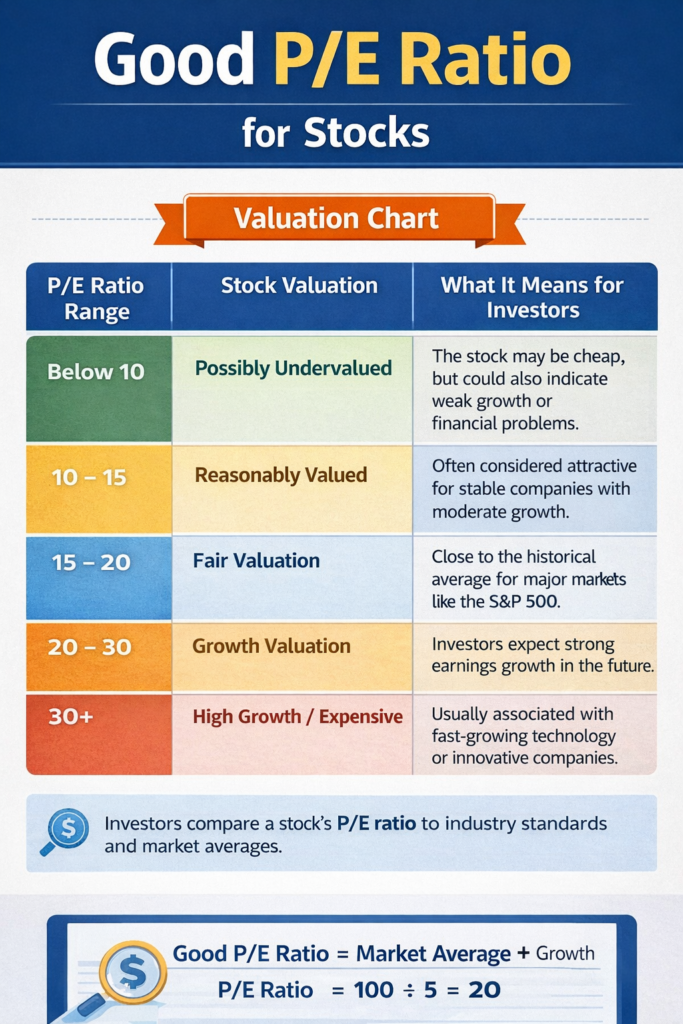
Good P/E Ratio for Stocks (Valuation Chart)
| P/E Ratio Range | Stock Valuation | What It Means for Investors |
|---|---|---|
| Below 10 | Possibly Undervalued | The stock may be cheap, but it could also indicate weak growth or financial problems. |
| 10 – 15 | Reasonably Valued | Often considered attractive for stable companies with moderate growth. |
| 15 – 20 | Fair Valuation | Close to the historical average for major markets like the S&P 500. |
| 20 – 30 | Growth Valuation | Investors expect strong earnings growth in the future. |
| 30+ | High Growth / Expensive | Usually associated with fast-growing technology or innovative companies. |
Example: How Investors Interpret the P/E Ratio
| Company | Stock Price | EPS | P/E Ratio | Interpretation |
|---|---|---|---|---|
| Company A | $100 | $10 | 10 | Possibly undervalued |
| Company B | $100 | $5 | 20 | Fair valuation |
| Company C | $100 | $2 | 50 | High growth expectations |
Sector-Based P/E Ratio Comparison
Different industries have different typical P/E ratios.
| Sector | Typical P/E Ratio |
|---|---|
| Technology | 25 – 40+ |
| Consumer Staples | 15 – 25 |
| Utilities | 10 – 20 |
| Banking & Financials | 8 – 15 |
This is why investors compare companies within the same industry rather than across completely different sectors.
Quick Rule Investors Use
Many professional investors use this simple rule:
Good P/E Ratio = Market Average ± Growth Rate
For example:
If the market average P/E is around 15–20, then:
- Fast-growing companies can justify P/E of 25–40
- Stable companies often trade around P/E of 15–20
- Very slow growth companies may trade around P/E of 8–12
6. Why High P/E Stocks Can Still Be Great Investments
When studying PE Ratio Explained, one common beginner mistake is avoiding stocks with high P/E ratios.
But some of the best investments in history always looked expensive.
Case Study: A High-Growth Tech Company
Imagine a technology company growing profits 30% per year.
Even if the P/E ratio is 40, investors might still buy the stock because earnings could grow rapidly.
Example:
Year 1 EPS = $2
Year 5 EPS = $7.4
If earnings grow that quickly, today’s high P/E becomes reasonable.
This is why growth companies often have high P/E ratios.
7. Why Low P/E Stocks Can Be Dangerous
Another important part of PE Ratio Explained is understanding why low P/E stocks can sometimes be dangerous. Low P/E ratios sometimes signal serious business problems.
This phenomenon is called a value trap.
A value trap occurs when a stock appears cheap but earnings are declining.
Example
Company B:
- Price = $20
- EPS = $4
- P/E = 5
This looks extremely cheap.
However, if profits collapse next year to $1, the real P/E becomes 20.
Investors who relied only on the current P/E ratio may be misled.
8. Industry Differences in P/E Ratio Valuations
In the context of PE Ratio Explained, industry differences play a major role in stock valuation. P/E ratios vary dramatically across industries.
Comparing companies from different sectors often leads to incorrect conclusions.
Technology Sector
Tech companies often have higher P/E ratios because investors expect rapid growth.
Typical P/E:
25 – 40+
Consumer Staples
Companies selling everyday goods like food or household products typically have stable growth.
Typical P/E:
15 – 25
Utilities
Utility companies grow slowly but provide stable income.
Typical P/E:
10 – 20
Banking
Banks are often valued based on price-to-book ratio, but P/E ratios still matter.
Typical P/E:
8 – 15
9. How Interest Rates Affect the P/E Ratio
Interest rates also affect PE Ratio Explained, because valuation multiples change when borrowing costs rise. Interest rates strongly influence stock valuations.
When interest rates are low, investors are willing to pay higher P/E ratios.
Why?
Because bonds and savings accounts produce very little return.
When interest rates rise:
- Stocks become less attractive
- P/E ratios tend to fall
This relationship is one reason why the stock market often struggles during aggressive central bank tightening cycles.
10. When the P/E Ratio Actually Matters for Investors
Understanding when the PE Ratio Explained concept actually matters can significantly improve investment decision-making. The P/E ratio becomes especially useful in certain situations.
1. Comparing Companies in the Same Industry
Example:
Two software companies:
Company A P/E = 30
Company B P/E = 18
If growth rates are similar, Company B might be undervalued.
2. Evaluating Mature Companies
Companies with stable profits often follow predictable valuation ranges.
Example:
Large consumer brands or telecom companies.
3. Market Valuation Analysis
Investors frequently analyze the P/E ratio of the entire stock market.
When the overall market P/E becomes extremely high, it may signal overvaluation.
11. When the P/E Ratio Does NOT Matter
There are situations where the P/E ratio is almost useless.
1. High-Growth Companies
Fast-growing businesses reinvest profits into expansion.
Earnings may appear small relative to future potential.
Example sectors:
- Artificial intelligence
- Cloud computing
- Biotechnology
2. Companies With Negative Earnings
If a company has negative profits, the P/E ratio cannot be calculated.
This is common in:
- Startups
- Early-stage tech firms
- Research-heavy industries
3. Cyclical Businesses
Some industries experience huge profit swings during economic cycles.
Examples:
- Airlines
- Energy
- Shipping
- Commodities
In these industries, earnings fluctuate dramatically, making the P/E ratio unreliable.
12. P/E Ratio vs Other Valuation Metrics
Although PE Ratio Explained is one of the most popular valuation tools, professional investors also compare it with other metrics. Professional investors rarely rely on just one metric. Investors should also learn how to read financial statements before analyzing stocks.
Other important valuation tools include:
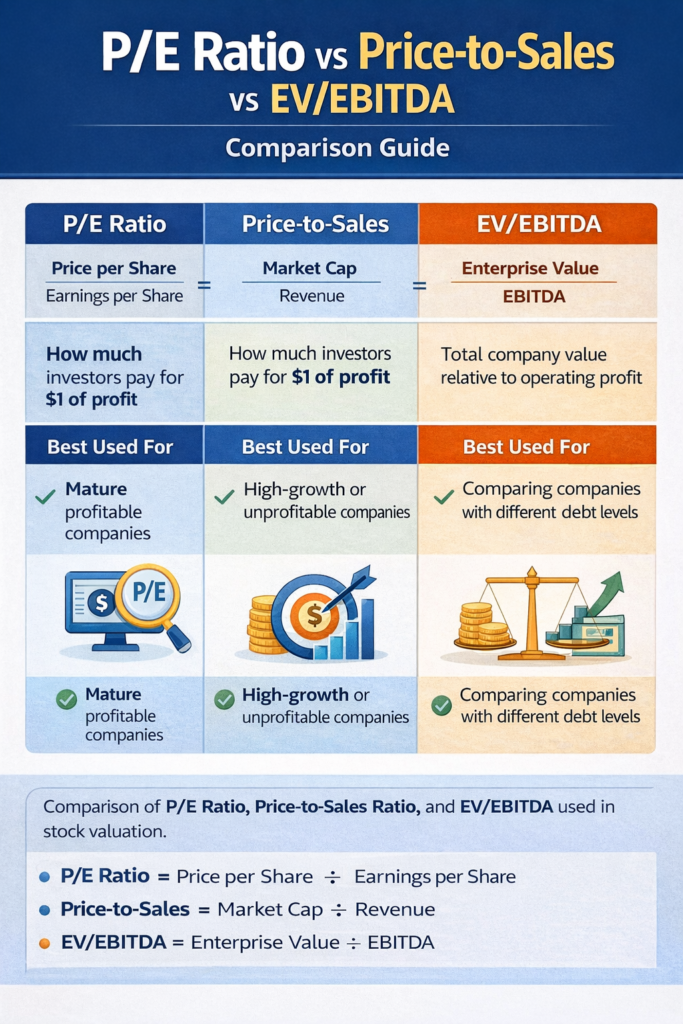
P/E Ratio vs Price-to-Sales vs EV/EBITDA (Comparison Guide)
Investors use several valuation metrics to determine whether a stock is undervalued, fairly valued, or overpriced. The three most widely used metrics are:
- P/E Ratio (Price-to-Earnings)
- Price-to-Sales (P/S Ratio)
- EV/EBITDA
Each metric evaluates a company from a different financial perspective, and professional investors often use them together rather than relying on only one.
Quick Comparison Table
| Metric | Formula | What It Measures | Best Used For |
|---|---|---|---|
| P/E Ratio | Price per Share ÷ Earnings per Share | How much investors pay for $1 of profit | Mature profitable companies |
| Price-to-Sales | Market Cap ÷ Revenue | How much investors pay for $1 of revenue | High-growth or unprofitable companies |
| EV/EBITDA | Enterprise Value ÷ EBITDA | Total company value relative to operating profit | Comparing companies with different debt levels |
1. P/E Ratio (Price-to-Earnings Ratio)
The P/E Ratio measures how much investors are willing to pay for each dollar of a company’s earnings.
Formula
P/E=SharePrice÷EarningsPerShare
Example
Stock price = $100
EPS = $5P/E=100÷5=20
Meaning investors pay $20 for every $1 of profit.
Best For
- profitable companies
- stable businesses
- long-term valuation comparison
Example companies often evaluated with P/E ratios include firms in the S&P 500 index.
2. Price-to-Sales Ratio (P/S Ratio)
The Price-to-Sales Ratio compares a company’s market value to its revenue.
This metric is useful when companies do not yet generate profits.
Formula
P/S=MarketCapitalization÷TotalRevenue
orP/S=PriceperShare÷RevenueperShare
Example
Market Cap = $10 billion
Revenue = $2 billionP/S=10÷2=5
Investors are paying $5 for every $1 of revenue.
Best For
- startups
- technology companies
- high-growth businesses
Many high-growth firms on the NASDAQ historically trade with higher price-to-sales ratios.
3. EV/EBITDA
EV/EBITDA measures the value of a company including its debt and cash position.
This makes it one of the most accurate valuation tools used by professional investors and private equity firms.
Formula
EV/EBITDA=EnterpriseValue÷EBITDA
Enterprise Value:EV=MarketCap+Debt−Cash
EBITDA stands for:
Earnings Before Interest, Taxes, Depreciation, and Amortization
Example
Market Cap = $10B
Debt = $3B
Cash = $1BEV=10+3−1=12B
EBITDA = $2BEV/EBITDA=12÷2=6
Best For
- comparing companies with different debt levels
- mergers and acquisitions
- capital-intensive industries
Investment banks such as Goldman Sachs frequently rely on EV/EBITDA in corporate valuation models.
When to Use Each Valuation Metric
| Situation | Best Metric |
|---|---|
| Company is profitable | P/E Ratio |
| Company has no profits | Price-to-Sales Ratio |
| Companies have different debt levels | EV/EBITDA |
| Comparing early-stage tech companies | Price-to-Sales |
| Comparing mature businesses | P/E Ratio |
Real-World Example
Imagine comparing three companies:
| Company | P/E | P/S | EV/EBITDA | Interpretation |
|---|---|---|---|---|
| Company A | 15 | 3 | 8 | Fair valuation |
| Company B | 40 | 12 | 25 | High growth expectations |
| Company C | 10 | 1 | 5 | Possibly undervalued |
Professional investors typically analyze multiple valuation metrics together to understand the full financial picture.
Key Takeaway
The P/E Ratio, Price-to-Sales Ratio, and EV/EBITDA each measure company valuation from different angles:
- P/E Ratio evaluates price relative to profits
- Price-to-Sales evaluates price relative to revenue
- EV/EBITDA evaluates company value relative to operating cash flow
Using all three together gives investors a more complete understanding of a company’s valuation.
13. Real-World Example: Two Different Companies
Let’s compare two fictional companies.
Company Alpha (Tech Growth)
Price = $200
EPS = $4
P/E = 50
Growth rate = 35% per year
Company Beta (Mature Utility)
Price = $40
EPS = $4
P/E = 10
Growth rate = 2% per year
At first glance, Beta appears cheaper.
However, if Alpha continues growing rapidly, its earnings could increase dramatically.
Long-term investors often prefer growth companies with high price-to-earnings multiple.
14. The “PEG Ratio” – A Better Metric?
Some investors use the PEG ratio, which incorporates growth.
Formula:
PEG = P/E ÷ Earnings Growth Rate
Example:
P/E = 30
Growth rate = 30%
PEG = 1
Interpretation:
| PEG | Meaning |
|---|---|
| Below 1 | Possibly undervalued |
| Around 1 | Fair value |
| Above 2 | Expensive |
The PEG ratio helps investors compare growth companies more accurately.
15. Historical Market Valuations
According to long-term historical data from the Federal Reserve and S&P Global, the average P/E Ratio of the S&P 500 has historically ranged between 15 and 20.
However, during speculative bubbles, valuations can rise dramatically.
Examples:
Dot-Com Bubble (2000)
Technology stocks traded at extremely high price-to-earnings multiple before collapsing.
Post-Pandemic Market Boom
In the early 2020s, massive stimulus and low interest rates pushed valuations higher.
Key P/E Ratio Statistics Investors Should Know (2026)
Understanding historical valuation data helps investors interpret whether the market is expensive or cheap relative to long-term averages.
| Statistic | Value |
|---|---|
| Average historical P/E of the S&P 500 | 15–20 |
| Typical technology sector P/E | 25–40 |
| Typical utility sector P/E | 10–20 |
| Peak P/E during the Dot‑Com Bubble | Above 40 |
These statistics highlight how stock market valuations change over time and across industries. Long-term data from organizations such as the Federal Reserve and S&P Global shows that market P/E ratios often rise during periods of economic optimism and fall during recessions or tightening monetary policy.
For investors, comparing today’s price-to-earnings multiple with historical averages can provide valuable context when evaluating whether the market may be overvalued or undervalued.
16. How Professional Investors Use P/E Ratios
Professional investors apply PE Ratio Explained within a broader financial analysis framework. Institutional investors rarely rely on the price-to-earnings multiple alone.
Instead, they combine it with:
- Revenue growth
- Profit margins
- Cash flow
- Debt levels
- Competitive advantages
The P/E ratio acts as one tool in a larger analytical framework.
17. Common P/E Ratio Mistakes Beginner Investors Make
Even after learning PE Ratio Explained, many beginner investors still make common mistakes when applying the metric. Many new investors misuse this metric.
Mistake 1: Comparing Different Industries
Tech companies and banks should not be compared using P/E.
Mistake 2: Ignoring Growth
High P/E stocks may actually be cheap if earnings grow quickly.
Mistake 3: Ignoring Debt
A company with heavy debt may appear cheap but carry serious risk.
Mistake 4: Using Only One Metric
Successful investors analyze multiple financial ratios together.
18. A Simple Framework for Using the P/E Ratio
After learning PE Ratio Explained, investors need a simple framework to apply it effectively. When evaluating a stock, ask:
- What is the company’s price-to-earnings ratio?
- How does it compare with industry averages?
- What is the expected earnings growth?
- Is the company’s profit stable or cyclical?
- Are interest rates affecting market valuations?
Using this framework prevents simplistic conclusions.
Related Valuation Terms Investors Should Know
When evaluating stocks, investors rarely rely on just one valuation metric. The price-to-earnings ratio is often used alongside other financial indicators to understand the full financial picture of a company.
Some commonly used metrics include:
• earnings per share (EPS)
• price-to-sales ratio (P/S)
• enterprise value to EBITDA (EV/EBITDA)
• price-to-book ratio (P/B)
• PEG ratio (price-earnings-to-growth)
Professional investors frequently analyze these metrics together when evaluating companies in major indexes like the S&P 500.
Using multiple valuation metrics helps investors avoid misleading signals that can occur when relying on a single indicator.
Frequently Asked Questions About the P/E Ratio
Conclusion: The PE Ratio Explained Is Powerful—but Limited
PE Ratio Explained shows how the market values a company’s earnings relative to its stock price. Understanding PE Ratio Explained helps investors evaluate stock valuations more intelligently. While the PE Ratio Explained concept is simple, applying it correctly requires context about growth, industry trends, and macroeconomic conditions. The Price-to-Earnings ratio remains one of the most widely used valuation tools in finance.
It provides a quick way to understand how the market values a company relative to its profits.
However, the P/E ratio should never be used in isolation.
A low price-to-earnings multiple does not automatically mean a stock is a bargain, and a high P/E ratio does not necessarily indicate overvaluation.
The true value of the P/E ratio emerges when it is combined with deeper analysis of:
- Growth potential
- industry trends
- competitive advantages
- macroeconomic conditions
For long-term investors, the P/E ratio is best viewed as a starting point, not the final answer.
When used correctly, it can help investors identify opportunities, avoid value traps, and build a more intelligent investment strategy in the complex global financial markets of today.