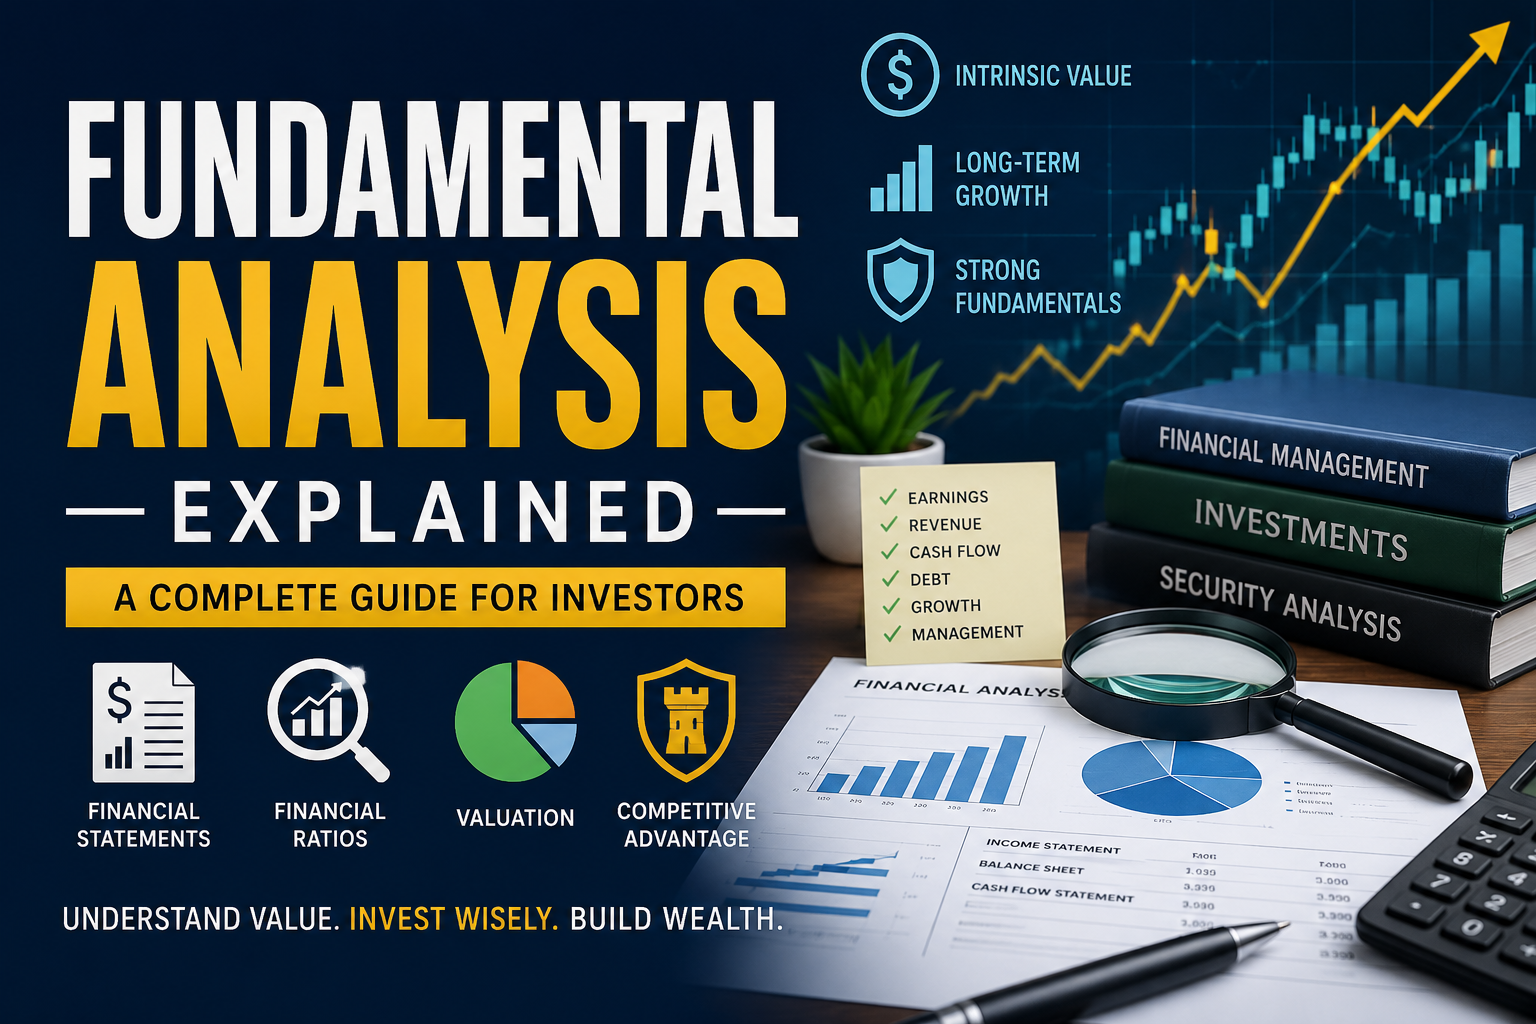
Fundamental Analysis Explained
Fundamental analysis is one of the most important concepts in investing. It helps investors determine whether a stock, business, or financial asset is worth buying by studying the company’s real financial health, business model, industry position, and future growth potential.
In simple terms:
Fundamental analysis tries to answer one question:
“What is this company truly worth?”
Professional investors, hedge funds, pension managers, and long-term wealth builders in countries like the United States, United Kingdom, Canada, and Australia rely heavily on fundamental analysis to make investment decisions.
Companies such as Apple Inc., Microsoft Corporation, Amazon.com, Inc., and The Coca-Cola Company are frequently studied through fundamental analysis because investors want to know whether their future earnings justify their current stock prices.
What Is Fundamental Analysis?
Fundamental analysis is the Fundamental Analysis Explained of evaluating a company’s:
- Financial statements
- Revenue growth
- Profitability
- Assets and liabilities
- Competitive advantage
- Management quality
- Industry conditions
- Economic environment
- Future growth prospects
The goal is to estimate the intrinsic value of a stock.
What Is Intrinsic Value?
Intrinsic value means the “real” or “fair” value of a company based on business fundamentals.
Example:
Imagine a company’s stock trades at $80, but after detailed analysis, an investor believes the company is actually worth $120.
That means:
- Market Price = $80
- Intrinsic Value = $120
The stock may be undervalued.
If the opposite happens:
- Market Price = $150
- Intrinsic Value = $120
The stock may be overvalued.
This idea is the foundation of value investing.
Why Fundamental Analysis Matters
Fundamental analysis helps investors:
- Avoid bad companies
- Identify strong businesses
- Invest for long-term wealth
- Reduce emotional investing
- Understand business risks
- Find undervalued stocks
- Predict future earnings growth
Without fundamental analysis, investing becomes speculation instead of informed decision-making.
Fundamental Analysis vs Technical Analysis
| Fundamental Analysis | Technical Analysis |
|---|---|
| Studies business value | Studies price charts |
| Focuses on long-term investing | Often used for short-term trading |
| Uses financial statements | Uses patterns and indicators |
| Examines company quality | Examines market behavior |
| Looks at earnings and growth | Looks at momentum and volume |
Example:
A long-term retirement investor in the USA may use fundamental analysis to evaluate AAPL before holding it for 20 years.
A day trader may use technical analysis to trade the same stock over a few hours.
Many professional investors combine both methods.
The Core Idea Behind Fundamental Analysis
The stock market sometimes prices companies incorrectly because of:
- Fear
- Panic
- Recession worries
- Media hype
- Investor emotions
- Economic uncertainty
Fundamental analysts believe:
In the long run, stock prices eventually reflect business performance.
If a company grows earnings consistently for years, its stock price usually rises over time.
Types of Fundamental Analysis
There are two major types:
1. Quantitative Analysis
Quantitative means numbers-based analysis.
This includes:
- Revenue
- Profit
- Earnings per share
- Debt
- Cash flow
- Financial ratios
Example:
An investor checks whether a company increased profits from $5 billion to $8 billion over five years.
2. Qualitative Analysis
Qualitative means non-numerical analysis.
This includes:
- Brand strength
- Leadership quality
- Competitive advantage
- Innovation
- Customer loyalty
- Company culture
Example:
Nike, Inc. has strong brand recognition globally, which is a qualitative advantage.
The Main Components of Fundamental Analysis
1. Revenue Analysis
Revenue is the total money a company earns from selling products or services.
Formula:
\text{Revenue} = \text{Price} \times \text{Units Sold}
Example:
If a company sells 1 million products at $100 each:
Revenue = $100 million
Why Revenue Matters
Revenue growth often indicates:
- Strong demand
- Expanding business operations
- Market share growth
2. Earnings Analysis
Earnings are profits remaining after expenses.
Important earnings metrics include:
- Net income
- Operating income
- EBITDA
- Earnings per share (EPS)
Earnings Per Share (EPS)
EPS measures profit allocated to each share.
Formula:
EPS = \frac{\text{Net Income} – \text{Preferred Dividends}}{\text{Average Outstanding Shares}}
Example:
- Net income = $5 billion
- Shares outstanding = 1 billion
EPS = $5
Higher EPS growth often attracts investors.
3. Profit Margin Analysis
Profit margin measures how much profit a company keeps from revenue.
Formula:
\text{Profit Margin} = \frac{\text{Net Profit}}{\text{Revenue}} \times 100
Example:
- Revenue = $100 million
- Profit = $20 million
Profit margin = 20%
Why It Matters
Higher margins often indicate:
- Strong pricing power
- Efficient operations
- Competitive advantage
Companies like Microsoft Corporation often maintain high margins due to software scalability.
4. Debt Analysis
Debt analysis examines how much money a company owes.
Too much debt can be dangerous because companies must continue paying:
- Interest
- Principal repayments
Even during recessions.
Debt-to-Equity Ratio
This compares debt with shareholder equity.
Formula:
\text{Debt-to-Equity Ratio} = \frac{\text{Total Debt}}{\text{Shareholders’ Equity}}
Example:
- Debt = $50 billion
- Equity = $100 billion
Debt-to-equity ratio = 0.5
Lower debt is usually safer, although acceptable debt levels vary by industry.
5. Cash Flow Analysis
Cash flow shows actual money moving in and out of the business.
A company can report profits but still face financial trouble if cash flow is weak.
Three major cash flow categories:
- Operating cash flow
- Investing cash flow
- Financing cash flow
Free Cash Flow (FCF)
Free cash flow is extremely important in valuation.
Formula:
FCF = \text{Operating Cash Flow} – \text{Capital Expenditures}
Strong free cash flow allows companies to:
- Pay dividends
- Buy back shares
- Reduce debt
- Invest in growth
6. Return on Equity (ROE)
ROE measures how effectively management uses shareholder money.
Formula:
ROE = \frac{\text{Net Income}}{\text{Shareholders’ Equity}} \times 100
Example:
- Net income = $10 billion
- Equity = $50 billion
ROE = 20%
Higher ROE often indicates strong management efficiency.
7. Price-to-Earnings Ratio (P/E Ratio)
The P/E ratio compares stock price with earnings.
Formula:
P/E = \frac{\text{Stock Price}}{EPS}
Example:
- Stock price = $100
- EPS = $5
P/E ratio = 20
This means investors pay $20 for every $1 of earnings.
Types of P/E Ratios
Forward P/E
Uses expected future earnings.
Trailing P/E
Uses past earnings.
Growth companies often trade at higher P/E ratios because investors expect future expansion.
8. Price-to-Book Ratio (P/B Ratio)
This compares stock price with company book value.
Formula:
P/B = \frac{\text{Market Price Per Share}}{\text{Book Value Per Share}}
Often used for:
- Banks
- Insurance companies
- Asset-heavy businesses
9. Dividend Analysis
Many investors in Tier-1 countries prefer dividend-paying stocks for passive income.
Dividend analysis includes:
- Dividend yield
- Dividend payout ratio
- Dividend growth history
- Sustainability
Dividend Yield
Formula:
\text{Dividend Yield} = \frac{\text{Annual Dividend Per Share}}{\text{Stock Price}} \times 100
Example:
- Annual dividend = $4
- Stock price = $100
Dividend yield = 4%
10. Competitive Advantage (Economic Moat)
A moat protects a company from competitors.
Common moats include:
- Strong brands
- Patents
- Network effects
- Cost advantages
- Customer loyalty
Example:
Visa Inc. benefits from a global payment network moat.
11. Industry Analysis
Even strong companies can struggle in weak industries.
Fundamental analysts study:
- Industry growth
- Competition
- Regulation
- Innovation trends
- Consumer demand
Example:
Electric vehicle growth helped companies like Tesla, Inc. expand rapidly.
12. Management Analysis
Management quality is critical.
Investors examine:
- CEO leadership
- Capital allocation
- Strategic decisions
- Corporate governance
- Transparency
Legendary investor Warren Buffett frequently emphasizes management quality.
Top-Down vs Bottom-Up Analysis
Top-Down Approach
Starts with:
- Global economy
- Country economy
- Industry
- Individual company
Example:
An investor expects AI growth globally, studies technology sectors, then researches companies like NVIDIA Corporation.
Bottom-Up Approach
Starts directly with company analysis regardless of economic conditions.
Example:
An investor studies a strong healthcare business even during recession fears.
Understanding Financial Statements
Financial statements are the foundation of fundamental analysis.
There are three primary statements.
1. Income Statement
Shows:
- Revenue
- Expenses
- Profit
Key metrics:
- Gross profit
- Operating income
- Net income
- EPS
2. Balance Sheet
Shows:
- Assets
- Liabilities
- Shareholder equity
Formula:
\text{Assets} = \text{Liabilities} + \text{Shareholders’ Equity}
3. Cash Flow Statement
Shows actual cash movement.
Important because:
“Cash is harder to manipulate than earnings.”
Important Financial Terms Explained
Assets
Things a company owns.
Examples:
- Cash
- Buildings
- Equipment
- Inventory
Liabilities
Things a company owes.
Examples:
- Loans
- Debt
- Salaries payable
Equity
Ownership value remaining after liabilities.
Market Capitalization
Total company market value.
Formula:
\text{Market Cap} = \text{Share Price} \times \text{Shares Outstanding}
Valuation Methods in Fundamental Analysis
1. Discounted Cash Flow (DCF)
DCF estimates future cash flows and discounts them to present value.
Core idea:
Money today is worth more than money tomorrow.
DCF is widely used by investment banks and institutional investors.
2. Comparable Company Analysis
Compares valuation ratios among similar companies.
Example:
Comparing:
- P/E ratios
- EV/EBITDA
- Revenue multiples
Between companies in the same industry.
Case Study 1: Apple Inc.


Apple Inc. is one of the most analyzed companies globally.
Why Investors Like Apple
Strong Revenue Growth
Apple generates hundreds of billions in annual revenue from:
- iPhones
- Services
- MacBooks
- Wearables
Massive Free Cash Flow
Apple produces enormous cash flow, enabling:
- Share buybacks
- Dividends
- Research investments
Strong Brand Loyalty
Customers remain loyal to Apple’s ecosystem.
This creates recurring revenue and pricing power.
Risks
Even great companies face risks:
- Slowing smartphone demand
- Regulatory pressure
- Supply chain dependence
Fundamental analysis balances both strengths and risks.
Case Study 2: Coca-Cola


The Coca-Cola Company is a classic defensive stock.
Why It Is Considered Stable
Global Brand
Coca-Cola operates worldwide.
Consistent Dividends
Dividend investors value predictable income.
Recession Resistance
Consumers often continue buying beverages even during economic slowdowns.
Case Study 3: Tesla


Tesla, Inc. demonstrates how growth investing affects valuation.
Why Tesla Was Different
Tesla traded at very high P/E ratios because investors expected:
- Rapid EV growth
- Future dominance
- Technology leadership
This shows:
Markets often price future expectations, not only current profits.
Advantages of Fundamental Analysis
1. Helps Long-Term Investing
Useful for retirement portfolios and wealth building.
2. Reduces Emotional Decisions
Investors rely on data instead of panic.
3. Identifies Quality Companies
Helps distinguish strong businesses from weak ones.
4. Supports Value Investing
Can uncover undervalued opportunities.
Disadvantages of Fundamental Analysis
1. Time-Consuming
Requires deep research.
2. Future Is Uncertain
Even strong analysis can be wrong.
3. Market Can Stay Irrational
Stocks may remain overvalued or undervalued for long periods.
Fundamental Analysis in Different Markets
United States
Investors heavily analyze:
- Quarterly earnings
- Federal Reserve policy
- Consumer spending
- Technology innovation
Major exchanges include:
- New York Stock Exchange
- NASDAQ
United Kingdom
UK investors often focus on:
- Dividend stocks
- Energy companies
- Banking sector
- FTSE 100 companies
Canada
Canadian investors commonly analyze:
- Banking stocks
- Energy producers
- Mining companies
Australia
Australian markets heavily feature:
- Mining companies
- Commodity exports
- Banking institutions
Key Economic Indicators Used in Fundamental Analysis
Investors also analyze the broader economy.
Important indicators include:
- Interest rates
- Inflation
- GDP growth
- Unemployment
- Consumer confidence
Interest Rates and Stocks
When interest rates rise:
- Borrowing costs increase
- Growth stocks may decline
- Consumer spending may slow
Central banks strongly influence markets.
Examples include:
- Federal Reserve
- Bank of England
Inflation and Company Performance
Inflation increases costs for:
- Materials
- Labor
- Transportation
Companies with strong pricing power often handle inflation better.
Fundamental Analysis and Value Investing
Value investors seek stocks trading below intrinsic value.
Famous value investors include:
- Benjamin Graham
- Warren Buffett
Benjamin Graham is widely considered the father of fundamental analysis.
Margin of Safety
A key value investing principle.
Example:
If intrinsic value is estimated at $100, an investor may only buy below $70 to reduce risk.
This difference is called the margin of safety.
Common Mistakes Beginners Make
1. Focusing Only on Stock Price
Cheap stock price does not mean cheap valuation.
2. Ignoring Debt
High debt can destroy companies during downturns.
3. Chasing Hype
Popular companies are not always good investments.
4. Ignoring Cash Flow
Profits without cash flow can be dangerous.
5. Overestimating Growth
Future growth projections may fail.
How Professionals Perform Fundamental Analysis
Institutional investors often:
- Build financial models
- Forecast earnings
- Analyze competitors
- Study management calls
- Review industry reports
- Calculate valuation models
Large investment firms employ entire analyst teams.
Tools Used for Fundamental Analysis
Investors commonly use:
- Annual reports
- SEC filings
- Earnings calls
- Financial databases
- Economic reports
Popular resources include:
Step-by-Step Process of Fundamental Analysis
Step 1: Understand the Business
Ask:
- How does the company make money?
- What products does it sell?
- Who are competitors?
Step 2: Study Financial Statements
Analyze:
- Revenue growth
- Profit margins
- Debt
- Cash flow
Step 3: Analyze Valuation
Check:
- P/E ratio
- P/B ratio
- DCF valuation
Step 4: Evaluate Competitive Advantage
Determine whether the company has long-term protection from competitors.
Step 5: Assess Risks
Consider:
- Recession risks
- Regulation
- Competition
- Technology disruption
Step 6: Compare Intrinsic Value With Market Price
Decide whether the stock appears:
- Undervalued
- Fairly valued
- Overvalued
Fundamental Analysis Example
Suppose an investor studies a software company.
Findings:
- Revenue growth: 20% annually
- Debt: Low
- Profit margins: High
- Cash flow: Strong
- Competitive advantage: Excellent
- Management: Strong
The investor estimates intrinsic value at $150 per share.
If market price is $100, the investor may buy.
If market price is $220, the investor may wait.
Long-Term Investing and Fundamental Analysis
Fundamental analysis is especially useful for:
- Retirement investing
- Pension portfolios
- Wealth preservation
- Dividend investing
- Long-term compounding
Long-term investors focus more on business quality than daily price movements.
Final Thoughts
Fundamental analysis is the art and science of understanding a business before investing in it. Instead of following market hype or emotional trends, investors study financial statements, profitability, competitive advantages, valuation metrics, industry conditions, and economic factors to estimate a company’s true worth.
The process requires patience, discipline, and continuous learning, but it helps investors make informed decisions based on evidence rather than speculation.
Successful fundamental analysis combines:
- Financial knowledge
- Business understanding
- Economic awareness
- Risk management
- Long-term thinking
Whether analyzing a global giant like Apple Inc., a dividend leader like The Coca-Cola Company, or a high-growth innovator like Tesla, Inc., the ultimate goal remains the same:
Identify businesses whose future value is greater than the current market price.
That principle forms the foundation of intelligent investing and long-term wealth creation.