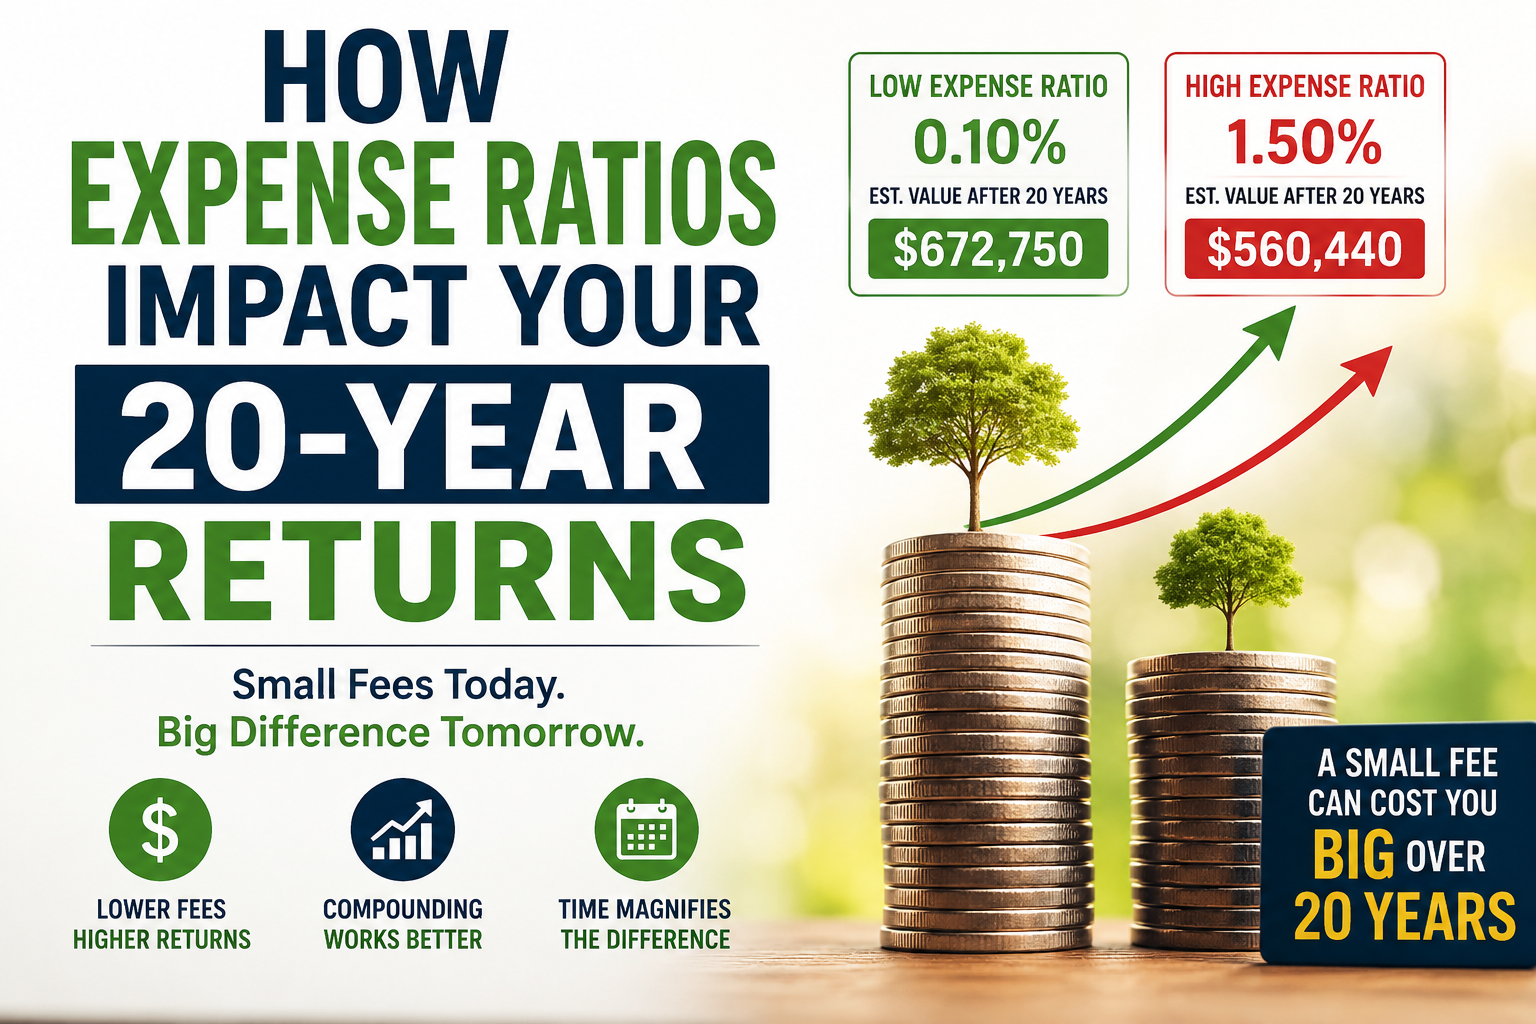
How Expense Ratios Impact Your 20-Year Returns
Investing is not only about choosing the right stocks, exchange-traded funds (ETFs), or mutual funds. It is also about understanding how much of your investment return remains in your pocket after costs.
How Expense Ratios Impact Your 20-Year Returns is an important question for anyone building long-term wealth. A difference between a 0.10% annual fund expense and a 1.50% expense may look insignificant when viewed over one year. However, when fees reduce the money available for compounding over two decades, the difference can become substantial.
Imagine two investors who each invest $100,000 in otherwise comparable portfolios. Both portfolios earn the same hypothetical 10% annual return before fund expenses. One investor pays a 0.10% annual expense ratio, while the other pays 1.50%. If those costs reduce the respective annual returns to approximately 9.90% and 8.50%, their ending balances will differ considerably.
This guide explains expense ratios, compound growth, ETF and mutual fund costs, documented investment research, practical fee comparisons, and strategies for evaluating investment expenses. It also distinguishes real historical evidence from hypothetical examples so readers can understand what the numbers do and do not prove.
What Is an Expense Ratio?
An expense ratio is the annual operating expense of a mutual fund or ETF expressed as a percentage of the fund’s assets. It indicates the proportion of fund assets used to cover eligible operating costs.
These expenses may include investment management, administration, accounting, custody, record keeping, and certain distribution or marketing costs, depending on the fund and its fee structure.
Investors generally do not receive a separate bill for the expense ratio. Instead, eligible expenses are paid from the fund’s assets, reducing the fund’s net asset value and investment performance compared with an otherwise identical portfolio without those expenses.
The US Securities and Exchange Commission explains how fund fees and expenses reduce investor returns in its Mutual Fund and ETF Fees and Expenses bulletin.
Understanding the Term “Ratio”
A ratio compares one quantity with another. For an expense ratio, annual fund operating expenses are compared with the fund’s average net assets over the relevant period.
For example, assume a fund has $1 billion in average net assets and $5 million in annual operating expenses.
The calculation is:
The expense ratio is calculated by dividing a fund’s annual operating expenses by its average net assets and multiplying the result by 100.
Expense Ratio = (Annual Operating Expenses ÷ Average Net Assets) × 100
In this example, the expense ratio is 0.50%, meaning the fund charges approximately $5 per year for every $1,000 invested, assuming the investment balance remains constant.
The ratio is a percentage, not a fixed dollar charge. The actual dollar amount associated with an investor’s holding changes as the investment value changes and as expenses accrue.
What Does an Expense Ratio Cost on Different Investments?
The following table illustrates the annual cost of different expense ratios on a hypothetical $10,000 investment.
| Expense ratio | Approximate annual cost |
|---|---|
| 0.03% | $3 |
| 0.10% | $10 |
| 0.25% | $25 |
| 0.50% | $50 |
| 1.00% | $100 |
| 1.50% | $150 |
| 2.00% | $200 |
These are simple illustrations based on a constant $10,000 balance. In practice, the investment value fluctuates, and the dollar expense varies accordingly.
A fund charging 1% does not necessarily deduct exactly $100 from a $10,000 holding at a single point in time. Actual expenses accrue over time and depend on the fund’s valuation and fee calculation.
Why Expense Ratios Matter So Much
The importance of expense ratios becomes clearer when an investor considers three factors: recurring costs, the length of the investment period, and the growth that the money used for fees could otherwise have earned.
A recurring fee does more than reduce the return for one year. It also reduces the capital available to generate future returns.
Consider an investor who begins with $50,000 and leaves the money invested for 20 years. If the portfolio earns a hypothetical 8% annually before expenses, a lower-cost fund leaves more of that growth invested than an otherwise comparable higher-cost fund.
The difference becomes more significant when the investor also makes regular contributions.
Compounding Drag
Compounding drag describes the reduction in long-term growth caused by recurring costs, including investment fees.
Suppose an investment grows from $10,000 to $10,800 during a year before expenses. If eligible expenses reduce the investor’s net return, the amount carried into the following year is smaller. The next year’s return is then earned on a lower balance.
This creates a cumulative effect: fees reduce current wealth and the future growth that wealth might have produced.
Fees are not the only factor affecting long-term returns. Market performance, inflation, taxes, investment allocation, and investor behaviour also matter. However, fund expenses are one of the costs investors can investigate and often control.
What Is Compounding?
Compounding occurs when investment earnings remain invested and generate additional earnings over time. Compounding means earning returns not only on your original investment but also on previous gains. Over time, your returns can generate additional returns, helping your investments grow exponentially. Understanding compound interest and long-term investing can help you see why even small annual fees may have a significant impact on your final portfolio value.
For example, a $10,000 investment earning a hypothetical 10% annually grows as follows:
- Year 1: $10,000 becomes $11,000.
- Year 2: $11,000 becomes $12,100.
- Year 3: $12,100 becomes $13,310.
The investment gains increase because each year’s growth is calculated on a larger balance.
This illustration assumes the same return every year. Real markets do not behave so predictably. Some years produce gains, others produce losses, and the sequence of returns affects actual results.
How Fees Hurt Compounding
When a fund’s operating expenses are deducted from its assets, the investor receives the fund’s return after those expenses rather than its hypothetical return before expenses.
For a simplified illustration, assume a 10% gross annual return and a 1% expense ratio. Subtracting the expense ratio from the gross return gives an approximate 9% net annual return.
This is a useful approximation for comparing scenarios, not a precise description of every fund’s daily fee calculation. A fund’s actual gross and net returns can also differ because of tracking error, trading costs, cash holdings, taxes, and other factors.
The key point is that a recurring expense reduces the amount of capital available for future growth.
Simple 20-Year Example
Consider an investor who invests $100,000 once and does not make any additional contributions or withdrawals.
Assumptions:
- Initial investment: $100,000
- Hypothetical annual return before fund expenses: 10%
- Investment period: 20 years
- Inflation and taxes: excluded
- Contributions and withdrawals: none
Scenario 1: No Fund Expenses
With a constant hypothetical annual return of 10%, the investment grows to approximately $672,750 after 20 years.
This is a mathematical benchmark, not a forecast of what any real investment will earn.
Scenario 2: A 1% Expense Ratio
For a simplified comparison, assume the annual net return is 9% after fund expenses.
The investment grows to approximately $560,440 over 20 years.
Total Difference
The difference between the two hypothetical ending values is approximately $112,310.
That is a substantial difference, but it is important to interpret it correctly. The calculation compares a 10% annual return with a 9% annual return; it does not represent a separate bill for $112,310. It represents the difference between two compound-growth paths.
Actual returns vary, and an investor’s realised costs and returns depend on the fund, market conditions, account type, and other expenses.
You can test how different investment periods, contribution amounts, and assumed returns affect your projected wealth using our free financial calculators. Remember that projections are estimates, not guarantees of future investment performance.
Expense Ratios and Long-Term Investing
The effect of recurring fees becomes increasingly important as the investment period grows. A fee that appears small in one year can make a much larger difference over several decades.
Time Magnifies Costs
Over five years: The difference between two fee levels may be relatively modest, depending on the investment and returns.
Over ten years: The cumulative effect becomes easier to see.
Over twenty years: A persistent difference in annual net returns can create a substantial gap between ending balances.
Over thirty to forty years: The effect may become especially significant for retirement portfolios and investments receiving regular contributions.
Time does not guarantee that the more expensive fund will underperform every lower-cost alternative. It does mean that, if two otherwise comparable investments earn the same gross return, the investment with lower ongoing costs generally retains more of that return.
Case Study: Two Investors
Consider two hypothetical investors who each contribute $500 at the end of every month for 20 years.
Both invest in broadly comparable portfolios with a hypothetical annual return of 10% before fund expenses.
- Investor A: Pays a 0.05% expense ratio.
- Investor B: Pays a 1.50% expense ratio.
The two investors contribute the same total amount: $120,000 over 20 years.
For a simplified illustration, assume net annual returns of 9.95% and 8.50%, respectively, with monthly compounding approximated using those annual rates.
Investor A would finish with approximately $376,000, while Investor B would finish with approximately $300,000. These rounded values are mathematical illustrations, not historical investment results, and the exact totals depend on the calculation convention.
The lesson is not that every low-cost fund will outperform every high-cost fund. It is that a higher-cost fund must deliver enough additional performance to compensate for its extra costs to leave the investor equally well off.
What Is an ETF?
An exchange-traded fund (ETF) is an investment fund whose shares trade on a stock exchange during market hours.
Depending on its strategy, an ETF may hold stocks, bonds, commodities, or other eligible assets. Some ETFs track broad market indexes, while others focus on sectors, countries, investment factors, or specialised strategies.
ETFs can offer diversification, transparency, and convenient trading. However, not all ETFs are inexpensive or diversified. A narrow thematic ETF may carry a higher expense ratio and greater concentration risk than a broad-market ETF.
Investors should compare the ETF’s objective, holdings, expense ratio, bid–ask spread, liquidity, and tracking performance before investing. To understand the differences between fund structures, diversification, and investing costs, explore our guide to ETFs and index funds.
What Is an Index Fund?
An index fund aims to track the performance of a specified market index rather than select investments primarily to outperform that index.
Examples of indexes include the S&P 500, which tracks a group of large US companies, and broad total-market indexes that represent a wider portion of a market.
An index fund can be structured as either a mutual fund or an ETF. These are different concepts: index fund describes the investment strategy, while ETF and mutual fund describe fund structures.
Index funds often have lower operating costs than actively managed funds because they generally do not require the same level of discretionary security selection. However, expenses vary across products, and passive funds are not automatically the best choice for every investor.
Active Investing vs Passive Investing
Active Investing
Active fund managers attempt to outperform a benchmark by selecting securities, changing portfolio allocations, or making other investment decisions.
Active management may involve research teams, analysts, portfolio managers, trading, and risk management. These activities can contribute to higher operating expenses.
A higher fee does not prove that a fund is poor. Some investors may value a particular active strategy, risk-management approach, or market exposure. Nevertheless, the fund must generate enough value after expenses to justify its additional cost.
Passive Investing
Passive funds generally seek to replicate an index or follow a systematic investment strategy.
Their operating costs may be lower because portfolio decisions are often rules-based. Some broad index funds charge very low expense ratios, although specialised passive funds can still be expensive.
The correct comparison is between funds serving similar purposes. Comparing a global stock ETF with a specialised emerging-market fund solely by expense ratio ignores differences in holdings and risk.
Why Low Fees Often Win
A lower expense ratio gives a fund a cost advantage when compared with an otherwise equivalent fund earning the same gross return. Whether it produces a better actual outcome also depends on performance, risk, tracking, taxes, and other costs.
Historical research illustrates why investors should be cautious about assuming that higher-cost active management will reliably outperform.
The SPIVA U.S. Year-End 2025 report from S&P Dow Jones Indices found that 79% of active large-cap US equity funds underperformed the S&P 500 in 2025. This is a documented one-year result, not proof that all active funds will underperform over every period. It also does not isolate expense ratios as the sole cause.
Investors should examine performance over appropriate periods and compare funds with relevant benchmarks. Lower costs can improve the odds of retaining more market returns, but they cannot eliminate investment risk or guarantee outperformance.
Understanding Net Returns
Gross Return
Gross return is the investment return before specified costs are deducted. The exact meaning depends on the data source: some published returns already include fund operating expenses, so investors should check the methodology before making comparisons.
Net Return
Net return is the amount remaining after the relevant costs have been accounted for.
For a simple example, a 10% gross return less a 1% annual expense ratio is often approximated as a 9% net return. Actual fund performance is calculated using the fund’s valuation and expense-accrual methods, so this subtraction is a simplification.
When comparing funds, make sure the figures use consistent periods and treatment of distributions, fees, and taxes.
The Hidden Nature of Expense Ratios
Expense ratios are easy to overlook because investors usually do not pay them as a separate monthly bill. The expenses are generally reflected in the fund’s net assets and performance.
A portfolio statement may show that an investment gained value without displaying every operating expense as a separate cash transaction. This can make it harder to recognise how much a recurring fee costs over time.
Investors can review the fund’s prospectus, fee table, annual report, and shareholder reports to understand the expenses they are paying.
Expense Ratio vs Trading Fees
An expense ratio is not the same as a trading fee.
Expense ratio: The fund’s annual operating expenses expressed as a percentage of its assets.
Trading costs: Costs associated with buying or selling investments. These may include brokerage commissions, bid–ask spreads, and market impact.
Some brokers offer commission-free ETF trading, but this does not mean that the ETF itself has no expenses. Similarly, a fund with a low expense ratio may still have a wide bid–ask spread or incur other costs.
Investors should evaluate the total cost of owning an investment rather than relying on a single percentage.
Real-World Expense Ratio Examples
Ultra-Low-Cost Index Funds
Some broad-market index funds have expense ratios measured in a few hundredths of a percentage point. At 0.03%, the simple annual cost on a constant $10,000 balance is $3.
For an example of current published fund-cost information, Vanguard reported an asset-weighted average expense ratio of 0.08% for its mutual funds and 0.50% for the industry average, excluding Vanguard, as of December 31, 2025. These are provider-reported averages, not a guarantee that a particular fund will have those costs or that one provider will suit every investor.
For an example of how a fund provider presents its fees, see Vanguard’s mutual fund fees and expenses page and review the expense information for the specific fund you are considering.
Actively Managed Funds
An actively managed fund might charge 1% or more annually, although actual fees vary substantially by strategy and share class.
On a constant $10,000 balance, a 1.50% expense ratio corresponds to approximately $150 per year. If the investment grows, the dollar amount associated with the same percentage can also rise.
The important question is whether the fund’s strategy and net performance justify its total cost compared with relevant alternatives.
Case Study: The SEC’s 20-Year Fee Illustration
A particularly useful documented example comes from the US Securities and Exchange Commission’s investor education material.
The SEC describes a hypothetical $10,000 investment earning a 10% annual return before expenses over 20 years. Under that example, a fund charging 1.50% in annual operating expenses grows to approximately $49,725, while a fund charging 0.50% grows to approximately $60,858.
SEC-published hypothetical example · 20 years
1.50% annual expenses
$49,725
0.50% annual expenses
$60,858
Difference in ending value: approximately $11,133.
These are illustrative calculations, not the results of two identified real investors or a forecast of future performance.
This example is especially useful because it isolates a meaningful fee difference while holding the assumed gross return and investment period constant. It demonstrates why comparing expense ratios before investing is worthwhile.
Case Study: Retirement Portfolio
Imagine a worker who invests $1,000 at the end of each month for 30 years. The investor is saving for retirement and plans to keep contributions invested rather than withdrawing them.
Suppose the portfolio earns a hypothetical 7% annually before fund expenses. Compare two simplified annual net-return assumptions:
- Lower-cost scenario: 6.90% after expenses.
- Higher-cost scenario: 5.50% after expenses.
The investor contributes $360,000 in total over 30 years. The difference in ending balances depends on the timing of contributions, the compounding convention, and the assumed returns.
This is a hypothetical planning example, not a real person’s documented retirement result. It illustrates why a retirement investor should review fund expenses early and periodically, particularly when contributions and compounding continue for decades.
A realistic retirement plan should also account for inflation, taxes, withdrawals, market volatility, and the possibility of returns being lower than expected.
Why Beginners Ignore Expense Ratios
New investors often focus on recent performance, famous fund managers, online recommendations, and the possibility of finding a winning investment.
These factors may attract attention, but they do not replace a review of costs.
A fund that recently outperformed may subsequently underperform. A fund with a low expense ratio may still carry substantial market risk. The aim is to assess fees alongside the fund’s objective, diversification, investment process, and risk.
A useful starting point is to compare funds that track the same index or provide similar market exposure. That makes it easier to see whether a higher fee buys a meaningful difference.
Expense Ratios and Market Downturns
Fund expenses do not disappear simply because markets decline.
Suppose a portfolio experiences a negative 5% gross return over a year. An annual expense ratio creates an additional drag on the net result. However, the exact net return cannot always be calculated by simply subtracting the expense ratio from the gross return, because expenses accrue over time and returns fluctuate.
Lower fees do not protect an investor from a bear market. They can, however, reduce one source of ongoing cost.
This distinction matters: fees affect how much of the investment result remains with the investor, while market risk determines how the underlying investments perform.
How Expense Ratios Affect Different Asset Classes
Stock Funds
Stock funds invest in shares of companies. Broad-market index funds can have low expense ratios, while active or specialised funds may charge more.
Bond Funds
Bond funds invest in government, corporate, or other debt securities. Their fees depend on the complexity of the portfolio, credit research, strategy, and fund structure.
International Funds
International funds may invest across countries and currencies. Their expenses can vary depending on market access, custody, research, and portfolio management.
Sector Funds
Sector funds focus on a specific part of the economy, such as healthcare, financial services, or technology. Investors should consider concentration risk as well as cost.
Thematic Funds
Thematic funds may focus on trends such as artificial intelligence, robotics, or clean energy. A compelling theme does not guarantee good investment returns. Review the fund’s holdings, expense ratio, valuation exposure, and concentration before investing.
Understanding Assets Under Management (AUM)
Assets under management (AUM) refers to the value of assets a fund or manager oversees.
Large funds can sometimes spread fixed operating costs across more assets, creating economies of scale. This may support lower expense ratios. However, size does not automatically make a fund cheaper, better, or more suitable.
Investors should compare the actual expense ratios and fund structures disclosed in official documents rather than assuming that a large fund is always the least expensive.
Why Some Funds Charge Higher Fees
Higher fees may reflect active management, specialised research, complex strategies, international operations, or distribution costs.
The existence of higher costs does not itself establish that a fund delivers better results. Investors should ask what service or investment exposure the additional cost provides and whether that benefit is worth paying for.
Compare similar funds on a like-for-like basis, including their objectives, benchmarks, risks, share classes, and full cost structures.
Expense Ratios and Risk
A high expense ratio is not itself proof that a fund takes more investment risk. Likewise, a low-cost fund is not automatically safe.
Risk depends on what the fund owns, how concentrated its holdings are, its use of leverage or derivatives, credit exposure, liquidity, and other factors.
A low-cost fund investing in a volatile sector may experience much larger losses than a higher-cost fund holding short-term government securities. The comparison would not be meaningful unless the investor also considered their different purposes and risk profiles.
The Psychology of Fees
People often pay more attention to large, immediate costs than to small recurring ones.
An expense ratio of 0.50% may seem unimportant compared with a large market gain or loss. Yet recurring fees deserve attention because they continue for as long as the investor holds the fund.
One practical habit is to review every investment’s expense ratio at least annually and whenever a fund is replaced, an account is transferred, or an adviser proposes a change.
The goal is not to eliminate every expense. It is to understand what you pay and whether the cost is justified.
Inflation and Expense Ratios
Inflation reduces the purchasing power of money. Investment expenses reduce the returns available to compound. They are separate effects and should not simply be added together without considering the order and method of calculation.
For example, an investment might earn a positive nominal return after fees but still lose purchasing power if inflation is sufficiently high.
When planning for long-term goals, consider returns after investment costs and inflation. For retirement, it is also important to account for taxes and the timing of withdrawals.
Expense Ratios in Bull Markets
When markets rise strongly, investors may focus on headline gains and pay less attention to expenses.
A high-cost fund can still produce a positive return during a bull market. The relevant question is whether its return after expenses compares favourably with an appropriate alternative that has similar exposure and risk.
A rising market can make many investment strategies appear successful. Comparing performance over longer periods and across different market environments provides a more complete picture.
Expense Ratios During Bear Markets
During a bear market, the underlying assets may lose value, while fund operating expenses continue to affect performance.
Lower expenses do not prevent losses, but they can help avoid unnecessary costs. Investors should not assume that switching funds during a downturn is automatically beneficial, because sales, taxes, transaction costs, and changes in risk exposure may also matter.
A long-term strategy should be based on goals, risk tolerance, diversification, and total costs—not on one market phase alone.
What Is Tracking Error?
Tracking error describes how much a fund’s returns vary from those of its benchmark over time, usually measured statistically.
An index fund may not match its benchmark perfectly because of expenses, trading costs, cash holdings, sampling methods, and other factors.
A low expense ratio can be helpful, but it does not guarantee the lowest tracking error. When comparing index funds, review both the expense ratio and how closely the fund has tracked its benchmark over an appropriate period.
The Power of Fee Reduction
Investors cannot control future market returns, inflation, or interest rates. They can, however, review costs and decide whether the expenses associated with an investment are reasonable.
Reducing unnecessary costs can improve the portion of returns retained by the investor, assuming other factors remain comparable.
A sensible review includes fund expenses, advisory fees, brokerage charges, trading spreads, taxes, and any account-level costs. A low expense ratio is one part of a broader cost assessment.
Case Study: A 40-Year Retirement Investor
Consider a hypothetical investor who begins with $50,000 and adds $500 at the end of every month for 40 years.
Suppose the portfolio earns a constant 7% annual return before fund expenses. For a simplified comparison, assume one portfolio earns 6.95% after expenses and another earns 5.50%.
Both scenarios use the same starting amount and monthly contribution. The difference in assumed net returns can create a substantial gap over 40 years because each contribution has time to compound.
These are illustrative assumptions, not documented returns from a real investor or a promise that either portfolio will achieve those rates. Real outcomes will depend on market performance, contribution timing, inflation, taxes, fees, and withdrawals.
The example demonstrates why long-term investors should assess recurring costs before committing to a strategy.
Common Myths About Expense Ratios
Myth 1: Higher Fees Mean Better Returns
Reality: Higher fees do not guarantee higher returns. An expensive fund needs to deliver enough additional performance or other value to justify its cost.
Myth 2: Small Percentages Do Not Matter
Reality: Recurring costs can reduce long-term compounding. Their effect depends on the investment amount, return, fee level, and holding period.
Myth 3: Expense Ratios Are the Only Investment Cost
Reality: Investors may also pay advisory fees, trading spreads, sales loads, commissions, account charges, and taxes. Some costs are not included in a fund’s expense ratio.
Myth 4: Cheap Funds Are Always Better
Reality: A low-cost fund may still have unsuitable holdings, concentration, risk, or tracking performance. Cost should be considered alongside investment purpose and portfolio fit.
What Is a Sales Load?
A sales load is a sales charge associated with purchasing or redeeming certain mutual fund shares. Depending on the fund, it may be charged when buying shares or when selling them.
A sales load is separate from the ongoing expense ratio. A fund can have a low annual expense ratio and still impose a sales charge, while another may have no sales load but charge higher ongoing expenses.
Read the fund’s prospectus and fee table to identify both transaction-related charges and recurring operating expenses.
Understanding Fee Layers
An investor’s total investment costs may include several components:
- Fund expense ratio.
- Financial adviser or portfolio-management fee.
- Brokerage commissions, if applicable.
- Bid–ask spreads and other trading costs.
- Account maintenance or platform fees.
- Taxes resulting from taxable transactions or distributions.
These costs should not be added blindly if one is already included in another reported figure. Instead, identify each cost, understand how it is calculated, and avoid double-counting.
Fund Turnover and Hidden Costs
Portfolio turnover measures how frequently a fund replaces its holdings over a given period.
A high turnover rate may indicate more trading, which can increase transaction costs. In taxable accounts, selling securities at a profit can also contribute to taxable distributions, depending on the fund and jurisdiction.
Trading costs and tax effects are not necessarily fully reflected in the expense ratio. Investors should review turnover, tax information, and published performance when comparing funds.
Tax Efficiency and Expense Ratios
Tax efficiency refers to how effectively an investment structure manages the timing and amount of taxes generated by its activities.
Some ETFs may be more tax-efficient than comparable mutual funds in certain circumstances, but this is not guaranteed for every fund, investor, or jurisdiction.
The tax outcome depends on the fund’s structure, holdings, distributions, account type, and local tax rules. Investors in the United States, United Kingdom, Canada, Australia, and India should use the rules that apply to their own accounts rather than assume that a tax benefit in one country applies elsewhere.
Expense Ratios in Retirement Accounts
Retirement accounts often hold investments for many years, making recurring costs worth reviewing.
In the United States, examples include 401(k) plans and individual retirement accounts (IRAs). Other countries have their own pension and retirement-saving arrangements.
An employer-sponsored plan may offer a limited fund menu, so the lowest-cost option is not always available. In that situation, compare the available funds’ fees, investment objectives, diversification, and risk.
Do not overlook plan-level administrative charges or advice fees. A fund’s expense ratio is only one component of the total cost of retirement investing.
Because retirement investments may remain invested for decades, even small differences in annual fund expenses can affect the amount of wealth accumulated. Read our guide to retirement investing basics to learn more about long-term investing, diversification, and retirement planning.
The Role of Robo-Advisors
Robo-advisors use software to help build or manage investment portfolios. Some use diversified ETFs and automated rebalancing to provide a relatively straightforward investment service.
The total cost may include the robo-adviser’s management fee plus the expense ratios of the underlying funds. There may also be other account or transaction charges.
Before choosing a service, review the complete fee schedule, the investment strategy, the rebalancing method, tax features, and the level of human support offered.
Evaluating a Fund Beyond Fees
A fund’s expense ratio matters, but it should not be the only selection criterion.
Before investing, assess:
- Diversification: What assets, sectors, and countries does the fund hold?
- Investment objective: Does it match the role you want the fund to play?
- Risk: What could cause significant losses?
- Tracking quality: If it follows an index, how closely has it tracked it?
- Liquidity: How easily can you buy or sell shares at reasonable prices?
- Tax implications: What distributions or taxable events might arise?
- Total costs: Are there additional adviser, platform, trading, or account fees?
A cheaper product is useful only if it provides suitable exposure for the investor’s goals. Fund costs should be evaluated alongside diversification, risk tolerance, and your investment time horizon. Our guide to portfolio strategy and asset allocation explains how different investments can work together within a long-term portfolio.
How to Find Expense Ratios
Expense ratios are typically disclosed in a fund’s prospectus, official fund website, fee table, and shareholder reports. Brokerage platforms and reputable financial data services may also display them.
When comparing two funds, confirm that you are looking at the same share class or a comparable product. Different share classes of the same fund may have different fees.
The FINRA Fund Analyzer can help eligible users compare the estimated costs of certain mutual funds and ETFs. The SEC also explains how to review fund expenses in its investor education resources.
What Is a Prospectus?
A prospectus is a formal disclosure document describing an investment fund. It generally covers the fund’s objectives, strategies, risks, fees, expenses, and other important information.
Read the fee table carefully. Check annual operating expenses, sales charges, any fee waivers or reimbursements, and the conditions under which those waivers may expire.
A prospectus is not a guarantee of performance, but it is an important source for understanding what the fund is designed to do and what it costs.
Why Warren Buffett Supports Low-Cost Index Funds
Warren Buffett has publicly advocated low-cost index fund investing for many ordinary investors who want broad market exposure without trying to select winning stocks.
The underlying reasoning is straightforward: a diversified index strategy can be simple to maintain, and low costs leave more of the market return with the investor. Buffett’s widely discussed wager against selected hedge funds also highlighted how fees can affect the relative results of active management.
This does not mean that every index fund will outperform every active fund. It means investors should be careful about paying high fees based solely on a promise of superior performance.
The Mathematics of Fee Compounding
Compounding is nonlinear: investment gains and losses affect the amount on which future returns are earned.
When two otherwise comparable portfolios experience the same gross returns but incur different ongoing costs, the lower-cost portfolio generally retains more capital for future growth.
The precise difference depends on the timing of fees, the return sequence, the contribution schedule, and the period invested. This is why a useful comparison should state its assumptions clearly rather than present one illustrative figure as a universal result.
Visualizing Compounding
Imagine two snowballs rolling down a hill. Both start at the same size, but one loses a small amount of material along the way.
At first, the difference may appear minor. Over time, the two snowballs can become noticeably different in size.
Recurring investment costs work in a similar way. They reduce the assets available to generate future returns, and the effect can build over a long holding period.
The analogy is simplified, but it explains why the long-term cost of an investment can be much greater than one year’s fee.
How Young Investors Benefit Most From Low Fees
Young investors often have decades before retirement. A small difference in ongoing costs can therefore affect many years of future compounding.
They may also have time to make regular contributions, increasing the amount of money exposed to the difference between two fee structures.
However, young investors should not select funds on cost alone. Diversification, risk tolerance, time horizon, and the ability to remain invested during market declines remain important.
How Older Investors Are Also Affected
Older investors may have less time before retirement, but fees remain relevant.
During retirement, recurring costs reduce the portion of portfolio returns available to support withdrawals. If an investor’s portfolio experiences weak returns while withdrawals continue, high costs may add to the pressure on the remaining balance.
Retirees should consider investment expenses alongside withdrawal rates, liquidity needs, asset allocation, inflation, and longevity risk. A lower fee cannot guarantee that retirement savings will last, but avoiding unnecessary costs can help preserve resources.
Practical Strategies to Reduce Expense Ratios
1. Use Broad Index Funds Where Appropriate
Broad-market index funds can provide diversified exposure at a relatively low cost. Check the fund’s actual holdings and expense ratio rather than assuming every index fund is inexpensive.
2. Compare Similar Funds
Compare funds with the same or similar objectives. A meaningful comparison includes expenses, benchmark, holdings, risk, tracking, liquidity, and tax considerations.
3. Avoid Unnecessary Complexity
Specialised or complex products may charge higher fees. Make sure the strategy serves a clear purpose in your portfolio before accepting the additional cost.
4. Review Retirement Accounts
Review the investment options in workplace retirement plans and personal retirement accounts. Check both fund expenses and any plan-level charges.
5. Watch Advisory Fees
If you pay a financial adviser or managed-account provider, ask for the total annual cost in both percentage and dollar terms. Understand which services the fee covers and whether fund expenses are additional.
Expense Ratios and Financial Freedom
Financial freedom depends on the relationship between savings, investment growth, spending, risk, and time. Expense ratios are one component of that relationship.
Reducing unnecessary fees can leave more money invested, but it cannot guarantee a specific retirement date or level of wealth. Investors still need a suitable savings rate, diversified portfolio, realistic expectations, and a plan for market downturns.
The most useful approach is to focus on the factors within your control while recognising that future investment returns remain uncertain.
Final Case Study: The Long-Term Cost of Higher Fees
Consider two hypothetical investors who each contribute $750 at the end of every month for 35 years.
Both portfolios are assumed to earn 7% annually before fund expenses. For a simplified comparison, one investor pays 0.05% in annual expenses and the other pays 1.50%. The calculation should use the same contribution timing and compounding convention for both investors.
The lower-cost portfolio would have a higher assumed net return, so its projected ending balance would be higher if all other factors remained equal. The difference could be substantial because the cost difference applies over many years of contributions and growth.
This is a hypothetical scenario, not a record of two real investors. Actual balances may be materially different because markets fluctuate, fees change, contributions may vary, and taxes and inflation affect results.
The lesson is to compare the cost of suitable alternatives before investing and to revisit those costs as your circumstances change.
Key Takeaways
- Expense ratios are recurring fund operating expenses. They are generally reflected in a fund’s net asset value and performance.
- Compounding magnifies the effect of recurring costs. The longer the investment period, the more important it becomes to understand fees.
- Lower costs do not guarantee better performance. They provide a cost advantage when comparing otherwise equivalent investments.
- Expense ratios are not the only costs. Trading spreads, advice fees, taxes, sales loads, and account charges may also matter.
- Use documented research and transparent calculations. Distinguish real historical evidence from hypothetical projections.
- Review the whole investment, not just the fee. Diversification, risk, tracking quality, liquidity, and suitability all matter.
Conclusion
How Expense Ratios Impact Your 20-Year Returns is not just a question of comparing percentages. It is a question of how recurring costs affect the amount of money that remains invested and available for future growth.
A difference of one percentage point can create a meaningful gap in a hypothetical 20-year projection. Official SEC examples and independent fund-performance research reinforce the value of understanding costs before choosing an investment.
The practical lesson is simple: compare similar funds, understand every layer of fees, review the fund’s official disclosures, and avoid paying more without a clear reason.
Long-term investing is about both earning returns and retaining as much of those returns as reasonably possible. Controlling unnecessary costs is one way investors can improve their chances of reaching their financial goals.
Financial disclaimer: This article is for educational purposes only and does not constitute individual financial, investment, tax, or legal advice. Investments can lose value, and past performance does not guarantee future results. Consider your goals, risk tolerance, local tax rules, and financial circumstances before investing.
Frequently Asked Questions About Expense Ratios
1. What is a good expense ratio for a long-term investor?
A good expense ratio depends on the investment strategy and the type of fund. Many broad-market index funds have very low expense ratios, while specialised or actively managed funds may charge more. Compare similar funds and consider their overall costs, risk, and performance rather than relying on one universal threshold.
2. How much can a 1% expense ratio cost over 20 years?
The cost depends on the initial investment, contributions, gross returns, and fee structure. In the hypothetical example in this article, a $100,000 investment growing at 10% annually before fees reaches approximately $672,750 after 20 years without fund expenses, compared with approximately $560,440 using a simplified 9% net annual return. The difference is about $112,310.
3. Are ETFs cheaper than mutual funds?
Not necessarily. Many ETFs and mutual funds offer low-cost index strategies, while others charge higher fees. Compare the actual expense ratios, trading spreads, commissions, and other relevant costs of the specific funds.
4. Do expense ratios change every year?
They can. Fund providers may change their expense ratios, and temporary fee waivers or expense reimbursements may expire. Review the latest prospectus and official fund disclosures rather than relying on an old fee figure.
5. Are expense ratios deducted monthly or annually?
Expense ratios are generally quoted as annual percentages, but eligible fund expenses typically accrue over time and are reflected in the fund’s assets and net asset value. Investors usually do not pay a separate annual bill for the expense ratio.
6. Can a high-expense-ratio fund outperform a low-cost fund?
Yes. A high-cost fund can outperform a lower-cost fund over a particular period. However, its gross performance must compensate for its additional costs to deliver a comparable or better net result. Past outperformance does not guarantee future success.
7. What is the difference between an expense ratio and a management fee?
A management fee typically pays for investment management. An expense ratio generally represents a broader measure of annual fund operating expenses and may include management and other eligible costs. Check the fund’s fee table to understand which expenses are included.
8. Do index funds have expense ratios?
Yes. Index funds have operating expenses even when they passively track a benchmark. Many broad-market index funds have low expense ratios, but fees vary between providers, indexes, and fund structures.
9. How can I compare mutual fund expenses before investing?
Read each fund’s prospectus and fee table. Compare expense ratios, sales charges, investment objectives, benchmarks, risks, and other costs. Investors can also use the FINRA Fund Analyzer to estimate and compare eligible funds’ costs.
10. Should I sell an expensive fund and switch to a cheaper one?
Not automatically. First, compare the funds’ objectives, holdings, risk, expected role in your portfolio, and total costs. Selling may trigger taxes, transaction expenses, or other charges. Consider whether the lower-cost alternative provides suitable exposure before making a decision.