1️⃣ Introduction: Why Risk Tolerance Is the Hidden Driver of Wealth
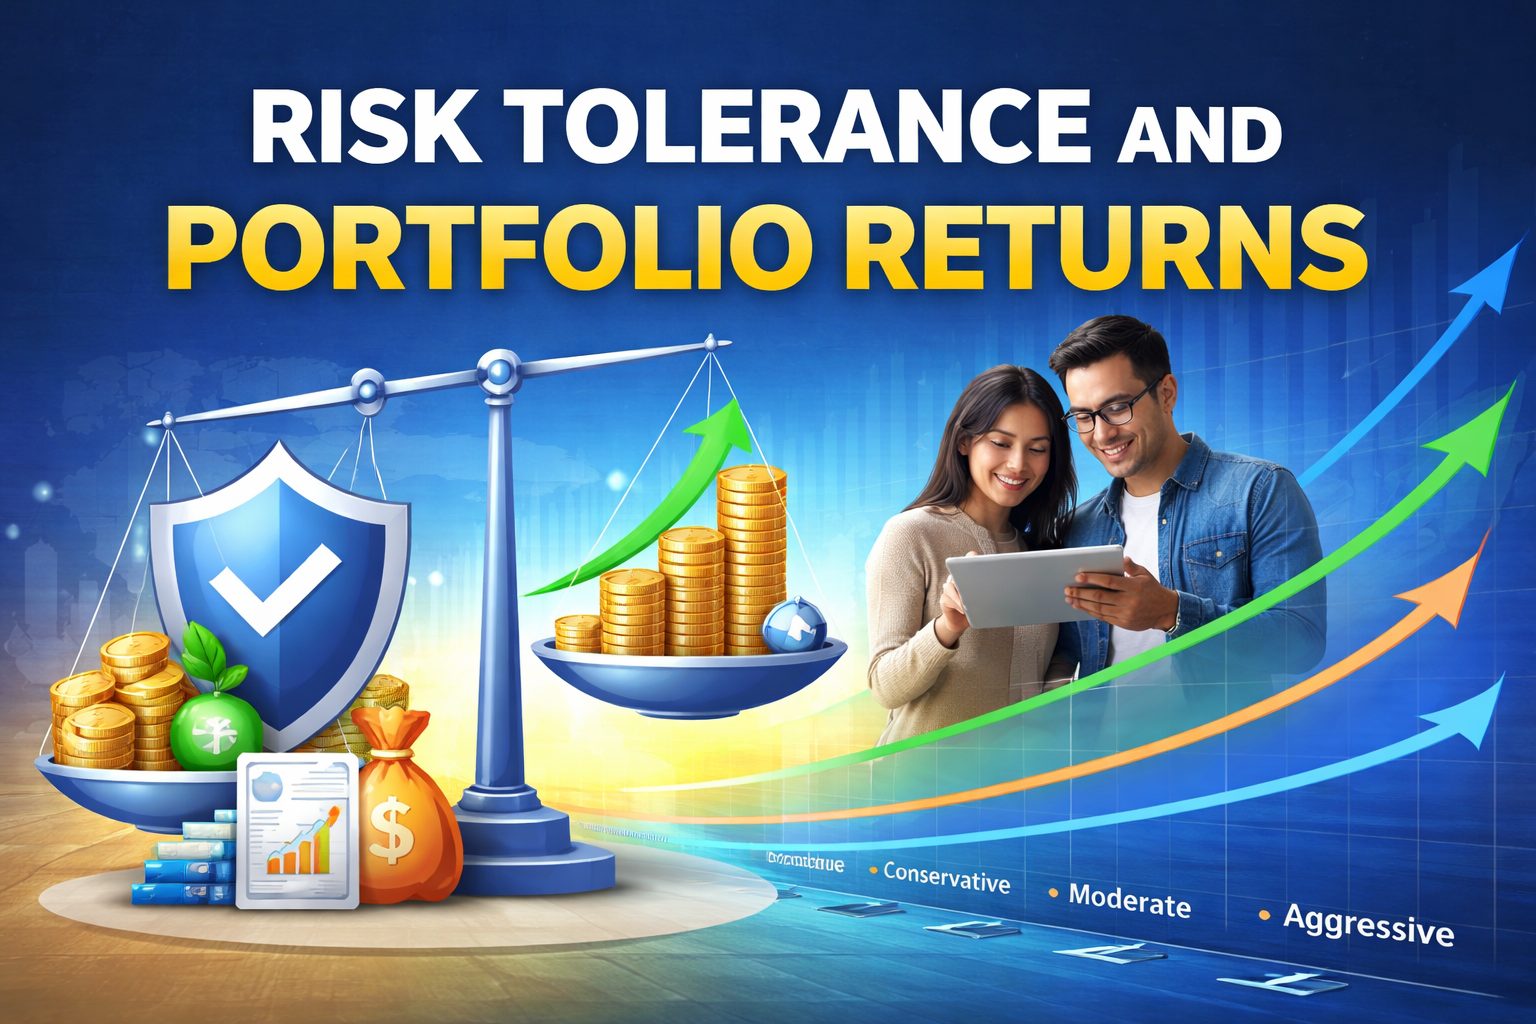
Risk tolerance and portfolio returns are deeply connected, yet most investors ignore this relationship. Understanding risk tolerance and portfolio returns helps investors make smarter long-term decisions. While many focus on picking the “right” stocks, the real driver of long-term wealth is how much risk you can handle emotionally and financially. Risk tolerance and portfolio returns are directly connected and play a critical role in long-term investing success.
Most investors obsess over:
- “Which stock will double?”
- “Should I buy tech or real estate?”
- “Is this the next big opportunity?”
But few ask the more important question:
How much risk can I emotionally and financially handle?
That answer — your risk tolerance — silently determines:
- Your asset allocation
- Your portfolio volatility
- Your long-term returns
- Your behavior during crashes
- Whether you build wealth or sabotage it
Many people believe returns are purely mathematical.
In reality, returns are behavioral.
To understand this properly, we need to define every key term carefully.
2️⃣ What Is Risk Tolerance and Portfolio Returns Relationship?
Financial Risk (Definition)
According to Investopedia, risk tolerance is the ability to handle market volatility and uncertainty in investment returns. Risk is the probability of losing money or earning less than expected.
In investing, risk is typically measured by:
- Volatility (price swings up and down)
- Standard deviation (statistical measure of return dispersion)
- Drawdown (peak-to-trough decline)
- Permanent capital loss (irrecoverable loss)
Example:
If a stock moves:
- +20% one year
- -25% next year
- +30% third year
That is high volatility.
If a bond moves:
- +3%
- +2%
- +4%
That is low volatility.
Risk is not just losing money — it is the uncertainty of outcomes.
3️⃣ How Risk Tolerance and Portfolio Returns Work Together
Definition
Risk tolerance is your psychological and financial ability to endure fluctuations in investment value without panicking or making destructive decisions.
It has two components:
- Emotional tolerance – Can you sleep when your portfolio drops 30%?
- Financial capacity – Can you survive financially if markets fall?
4️⃣ The Three Types of Risk Tolerance
1️⃣ Conservative Investor
2️⃣ Moderate Investor
3️⃣ Aggressive Investor
Let’s examine each carefully.
5️⃣ Conservative Investor


Definition
A conservative investor prioritizes capital preservation over growth. This shows how risk tolerance and portfolio returns differ for conservative investors.
They prefer:
- Government bonds
- Fixed deposits
- High-quality dividend stocks
- Cash equivalents
Typical Allocation
- 20–40% stocks
- 60–80% bonds/cash
Expected Long-Term Return
Historically (US data):
- 4–6% annually
Case Study: Anita (Age 60)
Anita retires with $500,000.
She cannot afford a 40% crash. So she invests:
- 30% stocks
- 70% bonds
If market crashes 40%:
- Her portfolio drops ~12%
- She stays calm
- She doesn’t sell
Over 20 years at 5% return:
$500,000 → ~$1.3 million
Stable. Predictable. Lower growth.
6️⃣ Moderate Investor



Definition
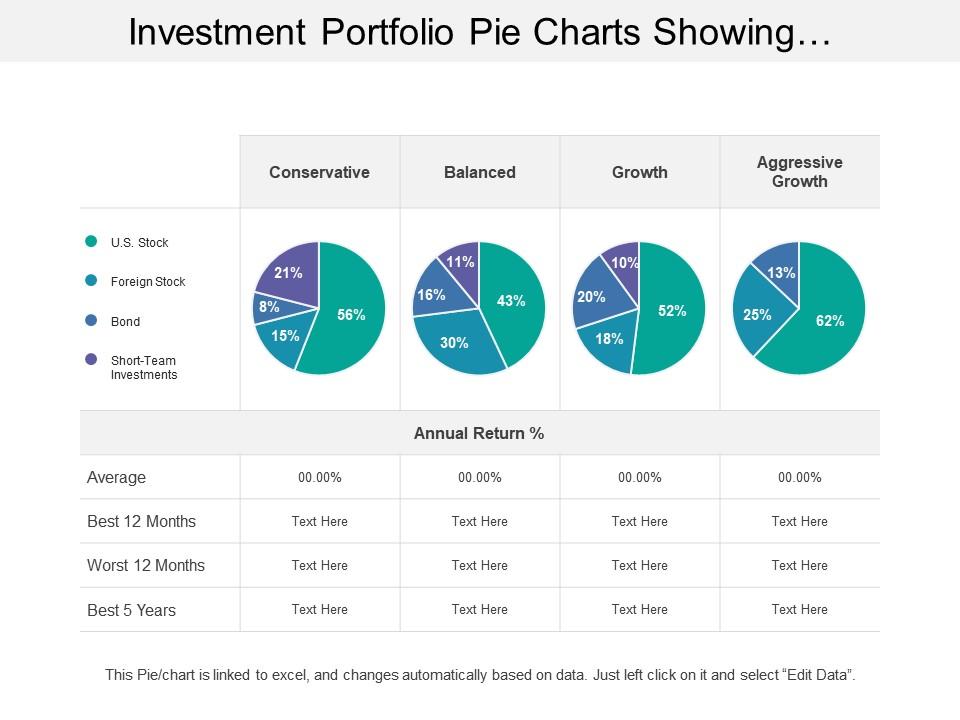
A moderate investor balances growth and stability. A balanced approach improves risk tolerance and portfolio returns stability.
Typical allocation:
- 50–70% stocks
- 30–50% bonds
Expected Return
Historically:
- 6–8% annually
Case Study: Rahul (Age 35)
Rahul invests $10,000 per year.
He uses:
- 60% global equity index
- 40% bond index
Average return: ~7%
Over 30 years:
$10,000/year at 7% → ~$1 million
During crashes:
- 2008-style drop: ~25%
- He continues investing
- Compounding resumes
Result: Strong growth without extreme stress.
7️⃣ Aggressive Investor


Definition
An aggressive investor prioritizes long-term growth over stability. Higher exposure increases both risk and portfolio returns potential.
Allocation:
- 80–100% stocks
- Possibly small-cap or emerging markets
Expected Return
Historically:
- 8–10%+ annually
Case Study: Arjun (Age 25)
Arjun invests $8,000/year in 100% equity index fund.
Market crash hits: -40%
He continues buying.
After 35 years at 9%:
$8,000/year → ~$1.9 million
Massive compounding advantage.
But if he panics and sells?
Returns collapse.
8️⃣ Historical Example: Risk Tolerance and Portfolio Returns in Market Crashes
Let’s examine:
📉 2008 Global Financial Crisis
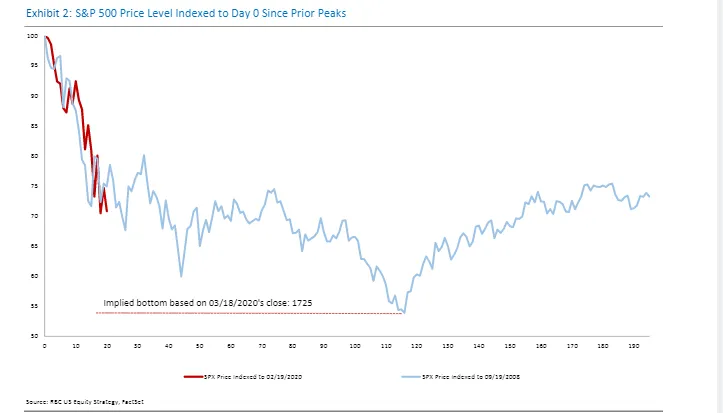
- Global markets fell ~50% peak to bottom.
- Many investors sold near bottom.
- Those who stayed invested recovered by 2013.
If you sold in 2009:
You locked in losses.
If you stayed invested:
Your portfolio doubled over next decade.
Risk tolerance determined outcome. The link between risk tolerance and portfolio returns becomes most visible during market crashes.
9️⃣ Why Risk Tolerance Determines Portfolio Returns
The U.S. Securities and Exchange Commission explains that investors should align risk tolerance with long-term financial goals. Higher risk assets historically produce higher returns.
Why?
Because investors demand a risk premium.
Risk Premium (Definition)
Extra return for taking additional uncertainty.
Example (historical US averages):
- Cash: 3%
- Bonds: 5%
- Stocks: 9–10%
Stocks return more because:
- Earnings fluctuate
- Prices crash
- Uncertainty exists
If stocks had no risk, they wouldn’t pay more.
How Risk Tolerance and Portfolio Returns Impact Long-Term Wealth
- Understanding risk tolerance and portfolio returns helps investors see how small return differences create massive long-term wealth gaps.
- The relationship between risk tolerance and portfolio returns becomes more powerful over time due to compounding.
🔟 Compounding Differences Over 30 Years
Research from Vanguard Group shows that asset allocation is the primary driver of long-term portfolio returns. created your Risk Tolerance and Portfolio Returns comparison chart based on:
- ₹10,000 yearly investment
- 30-year period
- 3 risk levels (5%, 7%, 9%)
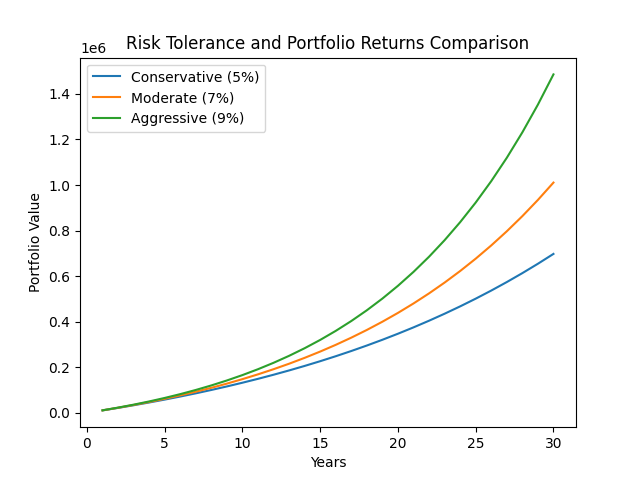
Key Insights the Chart
- Conservative investors grow slowly but steadily
- Moderate investors balance growth and stability
- Aggressive investors benefit most from compounding
The gap becomes huge after year 20 — this is where risk tolerance directly impacts wealth creation
Simple Explanation for Readers
This chart clearly shows that even a small increase in return (5% → 9%) leads to massive wealth differences over time. This is why choosing the right risk tolerance is critical for long-term portfolio returns.
Let’s compare $10,000 yearly investment:
- Conservative (5%)
- Moderate (7%)
- Aggressive (9%)
After 30 years:
- 5% → ~$665,000
- 7% → ~$945,000
- 9% → ~$1.36 million
Small difference in annual return = huge long-term difference.
That difference comes from risk exposure. Over time, risk tolerance and portfolio returns create exponential differences in wealth.
Common Mistakes in Risk Tolerance and Portfolio Returns Strategy
- Ignoring risk tolerance and portfolio returns alignment
- Taking too much risk during bull markets
- Taking too little risk due to fear
- Changing strategy during market crashes
- Not reviewing portfolio regularly
11️⃣ Behavioral Finance: The Real Danger
Understanding risk tolerance and portfolio returns helps avoid emotional investing mistakes. How to Build an Emergency Fund Fast. Studies show average investor earns less than market average.
🧠 1️⃣ Panic Selling
🔹 What it means
Panic selling happens when investors sell their investments during market crashes out of fear, instead of sticking to their long-term plan.
🔹 Why it happens
- When markets fall (e.g., -30% to -50%), fear takes over logic
- Investors think: “I will lose everything”
- Loss feels more painful than gains (this is called loss aversion)
🔹 Real impact on portfolio returns
- You lock in losses permanently
- You miss the recovery phase (which is usually fast and powerful)
- Your long-term return drops drastically
🔹 Example
During the 2008 Global Financial Crisis:
- Market fell ~50%
- Many investors sold at the bottom
- Market recovered within a few years
👉 Investor A (panic sold): lost 50% permanently
👉 Investor B (held): recovered + doubled wealth later
🔹 Key Insight
Panic selling breaks the link between risk tolerance and portfolio returns — because you exit before returns happen.
⏳ 2️⃣ Market Timing
🔹 What it means
Market timing is trying to:
- Buy at the lowest point
- Sell at the highest point
Sounds smart — but in reality, it rarely works.
🔹 Why it fails
- Markets are unpredictable in the short term
- Even professionals fail to time consistently
- Missing just a few best days destroys returns
🔹 Real impact on returns
- If you miss the top 10 best days in the market:
👉 Your returns can drop by 50% or more - Most of those best days happen:
👉 Right after big crashes
🔹 Example
Investor tries to “wait for the perfect time”:
- Market falls → waits more
- Market starts rising → waits for another dip
- Eventually buys at higher price
👉 Result: lower returns than simple long-term investing
🔹 Key Insight
Market timing reduces portfolio returns because consistency beats prediction.
❤️ 3️⃣ Emotional Decisions
🔹 What it means
Investors make decisions based on:
- Fear (during crashes)
- Greed (during bull markets)
- FOMO (fear of missing out)
Instead of logic or strategy.
🔹 Common emotional mistakes
- Buying when prices are high (greed)
- Selling when prices are low (fear)
- Following trends or “hot stocks”
🔹 Real impact on portfolio
- Buy high, sell low → worst possible combination
- Frequent changes → higher costs + lower returns
- No consistency → no compounding
🔹 Example
During a bull market:
- Everyone talks about stocks
- Investor buys at peak
Then crash happens:
- Fear kicks in
- Investor sells at loss
👉 This cycle repeats → wealth destruction
🔹 Key Insight
Emotional investing destroys risk tolerance and portfolio returns alignment.
📉 4️⃣ Behavior Gap (1–3% Loss Annually)
🔹 What it means
The behavior gap is the difference between:
- Market return
- Actual investor return
🔹 Why it exists
Because investors:
- Panic sell
- Time the market
- Act emotionally
🔹 Real data insight
Studies show:
- Market returns: ~8–10%
- Average investor earns: ~5–7%
👉 Difference: 1–3% per year lost
🔹 Why this is dangerous
Even a small difference destroys compounding:
- 10% return → massive wealth
- 7% return → significantly lower wealth
🔹 Example
₹10,000/year for 30 years:
- At 10% → ~₹1.97 crore
- At 7% → ~₹1.01 crore
👉 Lost: almost 50% wealth
🔹 Key Insight
The biggest risk is not the market — it’s your behavior.
Many investors fail because they ignore risk tolerance and portfolio returns alignment.
12️⃣ Risk Capacity vs Risk Tolerance
This is one of the most misunderstood concepts in investing.
You can feel comfortable with risk (tolerance), but still not be able to afford it (capacity).
🧠 1️⃣ Risk Tolerance = Psychological (Mindset)
🔹 What it means
Risk tolerance is your emotional ability to handle market ups and downs without panic.
🔹 Key characteristics
- Based on personality and mindset
- Some people are naturally calm, others panic quickly
- Not always logical — often emotional
🔹 How it shows in real life
- Can you handle a 30–40% portfolio drop without selling?
- Do you stay invested during market crashes?
- Do you trust long-term investing?
🔹 Example
Two investors with same income:
- Person A: stays calm during crash → high tolerance
- Person B: checks portfolio daily → panic → low tolerance
👉 Same financial situation, different psychology
🔹 Key Insight
Risk tolerance determines your behavior, and behavior determines your actual returns.
💰 2️⃣ Risk Capacity = Financial Ability
🔹 What it means
Risk capacity is your ability to take risk based on your financial situation.
🔹 Key factors
- Income stability
- Savings / emergency fund
- Debt level
- Time horizon
- Dependents (family responsibilities)
🔹 How it shows in real life
- Can you survive financially if markets crash?
- Do you need money in next 1–3 years?
- Can you wait 10+ years for recovery?
🔹 Example
Two investors:
- Person A: stable job + no debt → high capacity
- Person B: unstable income + loans → low capacity
👉 Even if both are “brave”, only one can afford risk
🔹 Key Insight
Risk capacity determines how much risk you should take, not how much you want to take.
👨💻 3️⃣ Example: 25-Year-Old Investor
🔹 Situation
- Stable income
- Long investment horizon (20–30 years)
- Few financial responsibilities
🔹 Why capacity is HIGH
- Time allows recovery from crashes
- Regular income supports continued investing
- No immediate need for money
🔹 Risk tolerance (possible)
- Often higher due to:
- Youth
- willingness to experiment
- exposure to growth mindset
🔹 Practical outcome
- Can invest heavily in equities (70–100%)
- Can tolerate volatility
- Benefits most from compounding
🔹 Key Insight
Young investors should use their high risk capacity wisely, not blindly.
👴 4️⃣ Example: 60-Year-Old Retiree
🔹 Situation
- No active income (or limited)
- Depends on investments for living
- Shorter time horizon
🔹 Why capacity is LOW
- No time to recover from big losses
- Needs regular withdrawals
- Market crash can damage lifestyle
🔹 Risk tolerance (possible mismatch)
- Some retirees still want high returns
- May feel confident → high tolerance
👉 But financially, they cannot afford big losses
🔹 Practical outcome
- Should reduce equity exposure
- Focus on stability and income
- Avoid large drawdowns
🔹 Key Insight
Even if tolerance is high, low capacity forces you to reduce risk.
⚠️ 5️⃣ Misalignment = Financial Disaster
This is the most important part.
🔴 Case 1: High Tolerance + Low Capacity (Danger)
Example:
- Retiree invests 100% in stocks
- Market crashes 40%
👉 Result:
- Portfolio crashes
- Cannot recover
- Forced to sell at loss
🔹 Why dangerous
- Overconfidence
- Ignoring financial reality
- Leads to permanent loss
🔴 Case 2: Low Tolerance + High Capacity (Missed Opportunity)
Example:
- Young investor keeps money in savings only
👉 Result:
- Very low returns
- Wealth grows slowly
- Loses to inflation
🔹 Why dangerous
- Fear blocks growth
- Under-utilization of opportunity
🔴 Case 3: Perfect Alignment (Ideal)
Example:
- Young investor: high equity
- Retiree: balanced portfolio
👉 Result:
- Sustainable growth
- Emotional stability
- Better long-term returns
🔹 Key Insight
Wealth is built when risk tolerance and risk capacity are aligned.
📊 SIMPLE COMPARISON TABLE
| Factor | Risk Tolerance | Risk Capacity |
|---|---|---|
| Type | Psychological | Financial |
| Based on | Emotions | Income & assets |
| Changes with | Experience | Life stage |
| Controls | Behavior | Allocation |
| Risk | Panic selling | Running out of money |
Your risk tolerance and portfolio returns strategy should match your financial goals.
13️⃣ Sequence of Returns Risk
Sequence of returns risk is one of the most critical (and dangerous) risks in investing—especially after retirement.
It’s not just how much return you earn, but when you earn it.
👴 1️⃣ Especially Important for Retirees
🔹 Why retirees are vulnerable
- Retirees are withdrawing money regularly (monthly expenses, lifestyle)
- Unlike young investors, they are not adding new money
- This makes their portfolio fragile during downturns
🔹 No time to recover
- Younger investors can wait 10–20 years
- Retirees may only have 15–25 years left
- A big loss early reduces the base permanently
🔹 Real impact
- Portfolio shrinkage + withdrawals = double damage
- Even if markets recover later, the capital is already reduced
🔹 Example
Retiree withdraws ₹5 lakh/year:
- If portfolio falls early → withdrawals continue
- Recovery happens → but on a much smaller base
👉 Result: lower lifetime wealth
🔹 Key Insight
Sequence risk matters more in retirement because money is flowing out, not in.
📉 2️⃣ If Market Drops Early in Retirement
🔹 What happens
- Portfolio falls (e.g., -30%)
- Retiree still needs money → forced withdrawals
- This locks in losses
🔹 Compounding works in reverse
- When you withdraw during a crash:
- You sell more units at low prices
- Portfolio recovery becomes harder
🔹 Permanent damage
- Even if market rebounds later:
- You now have less capital invested
- Future growth is weaker
🔹 Example
₹1 crore portfolio:
- Year 1 crash → ₹70 lakh
- Withdraw ₹5 lakh → ₹65 lakh
Even if market recovers:
👉 Growth happens on ₹65 lakh, not ₹1 crore
🔹 Key Insight
Early losses + withdrawals = permanent capital damage
⚠️ 3️⃣ Portfolio May Never Fully Recover
🔹 Why recovery becomes difficult
- Loss + withdrawal reduces base
- Future returns compound on smaller amount
- Time is limited
🔹 Mathematical reality
- A 50% loss requires 100% gain to recover
- But withdrawals make this even harder
🔹 Emotional impact
- Fear increases after losses
- Investor may shift to safer assets
- Misses recovery rally
🔹 Example
After early crash:
- Investor reduces equity exposure
- Market rebounds strongly
- Portfolio grows slowly
👉 Missed opportunity + permanent gap
🔹 Key Insight
Sequence risk can turn a “good average return” into poor real-life results
🔄 4️⃣ Same Average Return, Different Outcome
This is the most important concept.
🔹 Situation
Two retirees:
- Both earn 6% average return
- Same investment
- Same withdrawal
🔹 Difference
- Retiree A: bad returns early
- Retiree B: bad returns later
🔹 Why it matters
- Early losses hurt more
- Later losses hurt less (portfolio already grown)
🔹 Example
Retiree A:
- Year 1: -20%
- Then positive returns
Retiree B:
- First 10 years: +8%
- Later: -20%
👉 Retiree B is safer because:
- Portfolio grew before losses
- Withdrawals came from higher base
🔹 Key Insight
Same average return ≠ same outcome
Timing of returns changes everything
📊 5️⃣ Order of Returns Matters
🔹 Traditional thinking (wrong)
- “If average return is same, result will be same”
👉 This is true only without withdrawals
🔹 Reality (correct)
- With withdrawals:
- Early returns have huge impact
- Order affects survival of portfolio
🔹 Why order matters
- Early gains → build cushion
- Early losses → destroy base
🔹 Example
Two sequences:
Sequence A:
- -20%, -10%, +15%, +10%
Sequence B:
- +10%, +15%, -10%, -20%
👉 Same average, but:
- Sequence A struggles
- Sequence B survives
🔹 Key Insight
In retirement, return order matters more than return average
Balancing risk tolerance and portfolio returns is key to long-term success.
14️⃣ The Risk Tolerance Test Question
Scenario: Your $500,000 portfolio drops to $300,000 in 6 months (≈ -40%)
This is not hypothetical — drops like this have happened in events like the 2008 Global Financial Crisis.
👉 Your reaction reveals your true risk tolerance, not what you think it is.
🔴 A) Sell Everything
🔹 What this reaction means
- You have low risk tolerance
- You are uncomfortable with volatility and uncertainty
- Your priority is capital protection over growth
🔹 Why people choose this
- Fear of losing more money
- Lack of confidence in recovery
- Emotional stress becomes too high
🔹 Real impact on portfolio returns
- You lock in a 40% loss permanently
- You miss the market recovery (which is often fast)
- Your long-term returns drop significantly
🔹 Example
- Sell at $300,000
- Market recovers to $500,000+
- You re-enter late or not at all
👉 Result: permanent wealth loss
🔹 Key Insight
If you choose A, your current portfolio risk is too high for your tolerance.
🟡 B) Wait Nervously
🔹 What this reaction means
- You have moderate risk tolerance
- You can tolerate losses, but with stress
- You are unsure but willing to stay invested
🔹 Why people choose this
- They understand markets recover
- But emotionally struggle during downturns
- They constantly check portfolio and worry
🔹 Real impact on returns
- You stay invested → you benefit from recovery
- But stress may lead to:
- panic selling later
- poor decisions
🔹 Example
- Portfolio falls → you hold
- Market recovers → portfolio returns to growth
- But next crash → you might panic
👉 Result: average returns, emotional pressure
🔹 Key Insight
This is the most common investor type — but needs better discipline.
🟢 C) Invest More
🔹 What this reaction means
- You have high risk tolerance
- You see market crashes as opportunities
- You trust long-term investing
🔹 Why people choose this
- Strong understanding of market cycles
- Confidence in long-term growth
- Ability to control emotions
🔹 Real impact on portfolio returns
- Buying during crash = buying at lower prices
- When market recovers → higher returns
- This accelerates compounding
🔹 Example
- Portfolio drops to $300,000
- You invest additional money
- Market recovers → gains multiply
👉 Result: maximum long-term wealth growth
🔹 Key Insight
High risk tolerance allows you to benefit from volatility instead of fearing it.
⚖️ FINAL INTERPRETATION
| Answer | Risk Tolerance Level | Behavior | Result |
|---|---|---|---|
| A | Low | Panic selling | Losses locked |
| B | Moderate | Hold with stress | Average returns |
| C | High | Buy more | Higher returns |
15️⃣ Real Wealth Case Comparison
Person A (Conservative but consistent)
Invested for 35 years.
Never sold.
Earned 5%.
Result: $1.2 million.
Person B (Aggressive but emotional)
Invested in stocks.
Panicked in crashes.
Missed rebounds.
Actual return: 6% instead of 9%.
Result: $1.1 million.
Lower risk but discipline beat high risk without discipline.
16️⃣ Inflation Risk: The Silent Threat
Inflation is one of the most underestimated risks in investing.
It doesn’t crash your portfolio suddenly — it slowly erodes your wealth over time.
⚠️ 1️⃣ Low Risk Can Be Dangerous Too
🔹 What it means
Many investors think:
- “Safer is always better”
- “I don’t want to lose money”
So they choose:
- Fixed deposits
- Savings accounts
- Low-return assets
🔹 Why this is risky
- These investments often barely beat inflation (or don’t at all)
- Your money grows slowly, but prices rise faster
- You feel “safe”, but you are actually losing wealth silently
🔹 Example
- Investment return = 3–4%
- Inflation = 5–6%
👉 Real outcome: negative growth
🔹 Key Insight
Avoiding risk completely can be riskier than taking controlled risk.
📊 2️⃣ If Inflation = 4% and Return = 4% → Real Return = 0%
🔹 What it means
Real return = Actual return – Inflation
So:
- Portfolio return = 4%
- Inflation = 4%
👉 Real return = 0%
🔹 Why this matters
- Your money increases in number
- But buying power stays the same
- You are not becoming richer in real terms
🔹 Example
You have ₹1,00,000:
- After 1 year at 4% → ₹1,04,000
- But inflation increases costs by 4%
👉 What ₹1,00,000 could buy before = what ₹1,04,000 buys now
🔹 Long-term effect
Over 20–30 years:
- No real wealth creation
- Retirement planning fails
🔹 Key Insight
Nominal returns (numbers) can be misleading — real returns define actual wealth.
💸 3️⃣ You Are Not Growing Wealth
🔹 What it means
Even though your portfolio value increases:
- Your lifestyle doesn’t improve
- Your financial power stays stagnant
🔹 Hidden danger
- You think you are progressing
- But inflation cancels your growth
- This creates a false sense of security
🔹 Example
- Salary increases 5%
- Inflation also 5%
👉 You feel richer, but you are financially the same
🔹 Key Insight
Wealth is not about how much money you have — it’s about what your money can buy.
📉 4️⃣ Too Little Risk = Loss of Purchasing Power
🔹 What it means
If you avoid risk completely:
- You miss higher-return investments (like equities)
- Your returns stay low
- Inflation slowly eats your wealth
🔹 Why this happens
- Safe assets = low returns
- Growth assets = higher returns (but more volatility)
- Without growth, inflation wins
🔹 Example
Compare 30 years:
- Fixed deposit: ~5%
- Inflation: ~4%
👉 Real return: ~1%
vs
- Equity: ~10%
- Inflation: ~4%
👉 Real return: ~6%
👉 Huge difference in wealth
🔹 Key Insight
Taking no risk guarantees losing to inflation over time.
Ignoring inflation can break the balance between risk tolerance and portfolio returns, reducing real wealth over time.
17️⃣ Improving Risk Tolerance for Better Portfolio Returns
Consider:
- Age
- Income stability
- Debt level
- Time horizon
- Emotional stability
- Financial goals
Young tech professional in Mumbai with 30-year horizon?
More equity exposure likely reasonable.
Retiree depending on withdrawals?
More stability needed.
Your entire investing success depends on aligning risk tolerance and portfolio returns correctly.
18️⃣ Practical Portfolio Examples
Conservative Example
- 30% global equity index
- 60% government bonds
- 10% cash
Moderate Example
- 60% global equity
- 35% bonds
- 5% cash
Aggressive Example
- 90% global equity
- 10% emerging markets
Allocation drives volatility.
These examples show how risk tolerance and portfolio returns are directly linked through asset allocation.
Volatility drives behavior.
Behavior drives returns.
19️⃣ The Truth: Risk Tolerance Determines Maximum Return
Because:
- It determines asset allocation
- Allocation determines expected return
- Emotional stability determines whether you stay invested
If you cannot tolerate 40% drop, you cannot earn 9% long-term.
20️⃣ Final Case Study: Two 30-Year Investors
Investor 1 – 100% Equity (9%)
- Ends with $1.5M
- Stayed invested
Investor 2 – 60/40 (7%)
- Ends with $1M
- Slept peacefully
Both succeeded.
Failure only occurs when:
- Risk > tolerance
- Panic > discipline
This clearly proves how risk tolerance and portfolio returns influence final wealth outcomes.
Frequently Asked Questions
Q1: What is risk tolerance in investing?
Risk tolerance is your ability to handle market volatility without making emotional decisions.
Q2: How does risk tolerance affect portfolio returns?
Higher risk tolerance allows more equity exposure, which can increase long-term returns.
Q3: What happens if risk tolerance is too low?
You may earn returns below inflation, reducing real wealth.
Q4: Can risk tolerance change over time?
Yes, it changes based on age, income, and financial goals.
Q5: Should beginners take high risk?
Not always, it depends on financial stability and emotional comfort.
Q6: How do risk tolerance and portfolio returns relate?
Higher risk tolerance allows more equity exposure, leading to higher potential returns.
Q7: What is the ideal risk tolerance for long-term investors?
It depends on age, income, and goals, but higher equity exposure generally improves long-term portfolio returns.
Q8: Why do investors fail despite good portfolios?
Because they ignore risk tolerance and portfolio returns alignment and make emotional decisions.
Conclusion: Risk Tolerance Is Your Financial DNA
Ultimately, risk tolerance and portfolio returns define your financial future. Aligning risk tolerance and portfolio returns correctly is the key to sustainable wealth creation.
Risk tolerance impacts:
- Allocation
- Volatility
- Compounding
- Behavior
- Retirement outcome
The goal is NOT maximum return.
The goal is:
Maximum return you can stick with.
Because investing is not about intelligence.
It is about endurance.