Portfolio Correlation Explained
Portfolio Correlation Explained is one of the most important concepts in investing and portfolio management. Understanding how different assets move relative to each other helps investors reduce risk, improve diversification, and build more resilient portfolios. Whether you invest in stocks, bonds, ETFs, real estate, or alternative assets, portfolio correlation plays a critical role in long-term wealth creation.
Portfolio correlation is one of the most important concepts in modern investing, yet it is often misunderstood by beginner and even intermediate investors. In simple terms, correlation measures how different investments move in relation to each other. Understanding correlation helps investors build stronger portfolios, reduce unnecessary risk, improve diversification, and create more stable long-term wealth.
For investors in Tier-1 countries such as the United States, United Kingdom, Canada, and Australia, portfolio correlation plays a central role in retirement planning, wealth management, institutional investing, pension fund construction, and high-net-worth portfolio strategies.
This guide explains portfolio correlation in detail, including terminology, formulas, examples, historical case studies, and practical applications for real-world investing.
What Is Portfolio Correlation?
Portfolio correlation refers to the statistical relationship between the price movements of two or more assets.
It answers questions such as:
- Do these investments move together?
- Do they move in opposite directions?
- Does one investment remain stable while another fluctuates?
- How much diversification does this portfolio actually have?
Correlation is measured on a scale from:
- +1.0 → Perfect positive correlation
- 0 → No correlation
- -1.0 → Perfect negative correlation
The goal of portfolio management is usually not to eliminate risk completely, but to combine assets with different correlations so that the overall portfolio becomes more stable.
Understanding Correlation With Simple Examples
Imagine two stocks:
- Stock A = technology company
- Stock B = another technology company
If both rise and fall together most of the time, they have high positive correlation.
Now imagine:
- Stock A = airline company
- Stock B = oil producer
When oil prices rise:
- Airlines often suffer
- Oil producers often benefit
These may have lower or even negative correlation.
This relationship matters because owning assets that behave differently can reduce portfolio volatility.
The Correlation Scale Explained
Perfect Positive Correlation (+1)
When two assets move exactly together.
Example:
- Two ETFs tracking the same index
- Two large-cap tech funds
If one rises 10%, the other rises proportionally.
Risk
There is little diversification benefit because both assets behave similarly.
High Positive Correlation (+0.70 to +0.99)
Assets move mostly in the same direction but not perfectly.
Example:
- S&P 500 and growth stocks
- Global equities and U.S. equities
This is common inside stock-heavy portfolios.
Moderate Correlation (+0.30 to +0.69)
Assets share some relationship but not consistently.
Example:
- Stocks and real estate
- Value stocks and growth stocks
This can improve diversification.
Zero Correlation (0)
No predictable relationship.
Example:
- Gold and some alternative assets during certain periods
The movement of one asset provides no useful information about the other.
Negative Correlation (-1 to -0.01)
Assets move in opposite directions.
Example:
- Long-term government bonds during stock market crashes
- Defensive hedges against equities
Negative correlation is highly valuable during market stress.
Why Portfolio Correlation Matters
Correlation matters because diversification is not simply about owning many assets.
Owning:
- 20 technology stocks
- 10 crypto assets
- 5 growth ETFs
may still create a highly correlated portfolio.
A diversified portfolio requires investments that respond differently to:
- Economic growth
- Inflation
- Interest rates
- Recessions
- Geopolitical risks
- Monetary policy
Correlation helps investors avoid “hidden concentration risk.”
Diversification vs Correlation
Many investors confuse diversification with quantity.
Bad Diversification
An investor owns:
- Apple
- Microsoft
- Nvidia
- Amazon
- Meta
This appears diversified because there are five companies.
However, these companies often move together because they belong to similar sectors and respond to similar economic forces.
Correlation remains high.
Better Diversification
Another investor owns:
- U.S. stocks
- International stocks
- Government bonds
- REITs
- Gold
- Cash equivalents
These assets respond differently to market environments.
Correlation is lower.
Portfolio stability improves.
Correlation and Modern Portfolio Theory
Portfolio correlation became widely recognized through Harry Markowitz and his work on Modern Portfolio Theory.
The theory argues:
Portfolio risk depends not only on individual assets, but also on how assets interact with each other.
This changed investing forever.
Before this idea:
- Investors focused mainly on individual securities.
After this theory:
- Investors began focusing on portfolio construction.
The Mathematics of Correlation
Correlation is usually represented by the symbol:
[
\rho
]
The formula compares how two assets move relative to each other.
\rho_{X,Y}=\frac{\mathrm{Cov}(X,Y)}{\sigma_X\sigma_Y}
Where:
- ( \rho_{X,Y} ) = correlation coefficient
- Cov = covariance
- ( \sigma ) = standard deviation
Key Terms Explained
Covariance
Covariance measures whether assets move together.
Positive covariance:
- Assets rise and fall together.
Negative covariance:
- Assets move opposite each other.
Standard Deviation
Standard deviation measures volatility.
Higher standard deviation:
- Larger price swings
- Higher uncertainty
Lower standard deviation:
- More stable returns
Real-World Correlation Examples
Stocks and Bonds
Historically:
- Stocks and government bonds often showed low or negative correlation.
During stock crashes:
- Investors move money into safer government debt.
This helps bonds cushion equity losses.
Example:
- During the Global Financial Crisis, U.S. Treasury bonds performed strongly while equities collapsed.
Stocks and Gold
Gold often behaves differently from equities.
In periods of:
- Inflation fears
- Geopolitical instability
- Currency weakness
Gold may rise while stocks struggle.
However, correlation changes over time.
U.S. Stocks and International Stocks
Many investors assume international diversification guarantees low correlation.
But globalization increased interconnectedness.
Today:
- U.S. and international equities often move together during crises.
Correlation rises during panic periods.
Correlation Changes Over Time
One major mistake investors make is assuming correlation is permanent.
It is not.
Correlation is dynamic.
Assets that once diversified portfolios may suddenly move together during crises.
This is called:
Correlation Breakdown
or
Correlation Convergence
Example: 2020 COVID Market Crash
During the early stages of the COVID-19 pandemic:
- Stocks fell sharply
- Oil collapsed
- Real estate declined
- Even gold initially sold off
Investors rushed into cash.
Correlation between risky assets increased dramatically.
This showed that:
- Diversification can weaken during extreme panic.
Correlation During Inflationary Periods
In the 1970s:
- Inflation surged
- Bonds struggled
- Stocks also faced pressure
Traditional stock-bond diversification became less effective.
This is important because:
- Correlation depends heavily on macroeconomic regimes.
Asset Classes and Typical Correlations
Equities
Highly correlated with:
- Economic growth
- Corporate earnings
- Interest rate expectations
Bonds
Sensitive to:
- Interest rates
- Central bank policy
- Inflation expectations
Government bonds often diversify stock portfolios.
Real Estate
Real estate investment trusts (REITs) can correlate with:
- Stocks
- Interest rates
- economic growth
But physical real estate behaves differently than publicly traded REITs.
Commodities
Commodities respond to:
- Inflation
- Supply shocks
- Global demand
Examples:
- Oil
- Natural gas
- Agricultural products
Cash
Cash has near-zero volatility.
While returns may be low, cash provides:
- Stability
- Liquidity
- Optionality during crises
Correlation and Portfolio Risk
Correlation directly affects portfolio volatility.
Two risky assets combined can sometimes create:
- Lower overall risk than either asset individually.
This surprises many investors.
Example Portfolio
Imagine:
| Asset | Expected Return | Volatility |
|---|---|---|
| Stocks | 10% | 18% |
| Bonds | 4% | 6% |
If stocks and bonds are negatively correlated, portfolio volatility may fall substantially.
That is why balanced portfolios exist.
The 60/40 Portfolio and Correlation
The classic:
- 60% stocks
- 40% bonds
portfolio became popular partly because of historically favorable stock-bond correlations.
genui{“math_block_widget_always_prefetch_v2”:{“content”:”y=0.6x+0.4″}}
When stocks declined:
- Bonds often stabilized returns.
This created smoother long-term growth.
However:
- Rising inflation and interest rates can weaken this relationship.
Correlation vs Causation
A critical investing principle:
Correlation does not mean causation.
Two assets may move together temporarily without directly influencing each other.
Example:
- Tech stocks and cryptocurrency sometimes rise together.
This does not mean one causes the other.
Both may simply respond to:
- Liquidity
- Investor sentiment
- risk appetite
Sector Correlation
Within equities, sectors have different correlation levels.
High Correlation Sectors
Examples:
- Technology
- Consumer discretionary
- Growth stocks
Lower Correlation Sectors
Examples:
- Utilities
- Healthcare
- Consumer staples
Defensive sectors often behave differently during recessions.
International Correlation
Developed Markets
Examples:
- Germany
- Japan
- United Kingdom
These markets are increasingly connected with U.S. markets.
Emerging Markets
Examples:
- India
- Brazil
- China
Emerging markets sometimes provide diversification benefits but can also experience extreme volatility.
Correlation and Retirement Portfolios
Retirement investors must pay close attention to:
- Sequence-of-return risk
- Drawdowns
- capital preservation
Correlation matters because large simultaneous declines across assets can damage retirement sustainability.
Case Study: The Yale Endowment
Yale University’s endowment became famous for diversified investing under David Swensen.
The strategy included:
- Equities
- Private equity
- Real assets
- Hedge funds
- International investments
The goal was to combine assets with varying correlations.
This helped reduce dependence on traditional stock markets.
Case Study: Ray Dalio’s All Weather Portfolio
Ray Dalio developed the “All Weather” concept.
The idea:
- Build a portfolio capable of surviving different economic conditions.
Assets were selected based on:
- Correlation
- Economic sensitivity
- inflation behavior
- growth environments
The strategy emphasized risk balancing rather than simply maximizing returns.
Correlation During Crises
A major investing reality:
Correlations Often Rise During Market Crashes
Why?
Because:
- Investors panic simultaneously
- Institutions reduce leverage
- Liquidity disappears
- Forced selling increases
This explains why:
- Many “diversified” portfolios still suffer during crises.
Hidden Correlation Risk
Many investors unknowingly own correlated assets.
Example:
- Tech ETF
- Nasdaq ETF
- AI stocks
- Growth mutual funds
These may appear diversified but are heavily exposed to the same drivers.
This creates:
- concentration risk
- systemic vulnerability
Correlation and ETFs
ETFs make diversification easier but can also hide correlation exposure.
Example:
- Owning multiple broad-market ETFs may still result in overlapping holdings.
Investors should analyze:
- Top holdings
- sector weights
- geographic exposure
- factor exposure
Factor Investing and Correlation
Factors are investment characteristics.
Examples:
- Value
- Growth
- Momentum
- Quality
- Small-cap
Different factors have different correlations.
Combining factors can improve diversification.
Correlation and Inflation
Inflation changes relationships between assets.
During high inflation:
- Bonds may struggle
- Commodities may outperform
- Gold may become more attractive
Understanding macroeconomic correlation is critical for wealth preservation.
Correlation and Interest Rates
Interest rate changes affect nearly all assets.
Examples:
- Rising rates may hurt growth stocks
- Falling rates may help bonds
- Real estate may weaken with higher financing costs
Interest rate environments strongly influence correlation patterns.
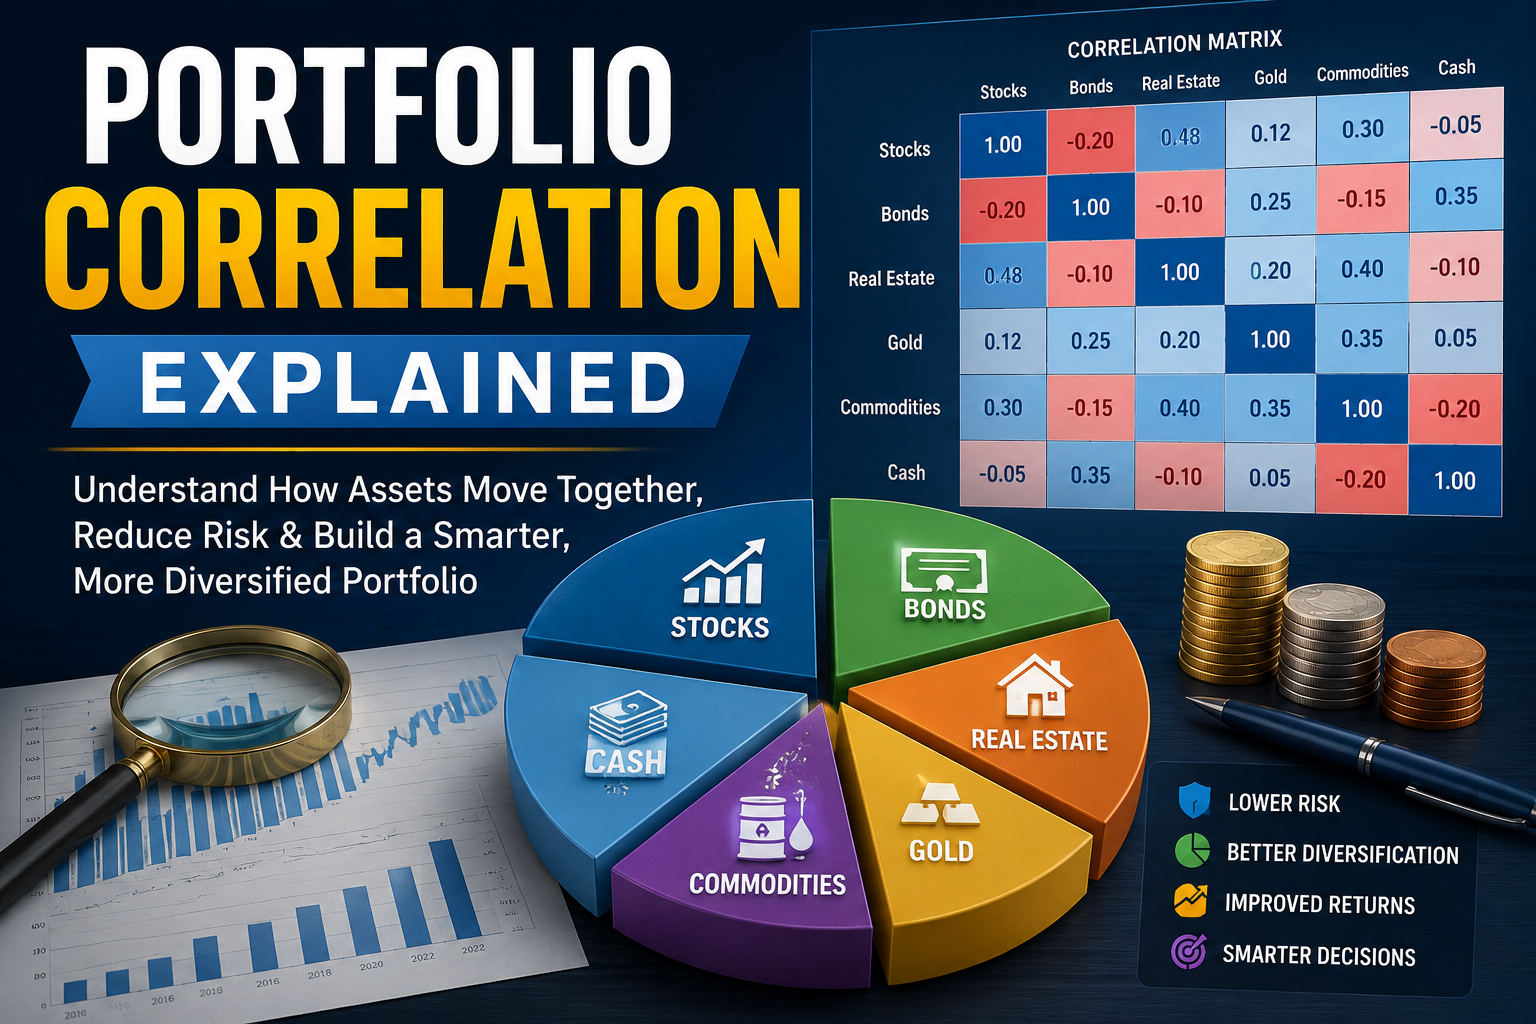
Correlation Matrices
Professional investors use:
Correlation Matrices
These tables show correlation relationships among many assets simultaneously.
Example:
| Asset | Stocks | Bonds | Gold |
|---|---|---|---|
| Stocks | 1.0 | -0.2 | 0.1 |
| Bonds | -0.2 | 1.0 | 0.0 |
| Gold | 0.1 | 0.0 | 1.0 |
This helps optimize allocation decisions.
Low Correlation vs Negative Correlation
These are not the same.
Low Correlation
Assets move independently.
Negative Correlation
Assets actively move opposite each other.
Negative correlation provides stronger diversification benefits.
Correlation and Volatility Reduction
One of the biggest benefits of diversification is reducing volatility.
Lower volatility helps investors:
- Stay invested
- avoid panic selling
- improve long-term compounding
- reduce emotional mistakes
Emotional Investing and Correlation
Highly correlated portfolios can experience:
- severe drawdowns
- emotional stress
- panic selling
A smoother portfolio helps investors remain disciplined.
Behavioral finance matters as much as mathematics.
Correlation and Risk-Adjusted Returns
Professional investors focus on:
- Return per unit of risk
Not just raw returns.
Lower-correlation assets can improve:
- Sharpe ratio
- portfolio efficiency
- stability
Correlation and Institutional Investors
Large institutions such as:
- pension funds
- sovereign wealth funds
- university endowments
heavily analyze correlation.
Their goals include:
- capital preservation
- liability management
- long-term sustainability
Correlation and Alternative Investments
Alternative assets may provide diversification.
Examples:
- Hedge funds
- Infrastructure
- Private equity
- Farmland
- Timberland
However:
- alternatives are not automatically low correlation.
Some behave similarly to equities during crises.
Correlation and Cryptocurrency
Cryptocurrency initially appeared uncorrelated with traditional markets.
But over time:
- Bitcoin and tech stocks became increasingly correlated during risk-on environments.
This shows:
- asset relationships evolve.
Common Mistakes Investors Make
1. Owning Too Many Similar Assets
More holdings do not guarantee diversification.
2. Ignoring Economic Drivers
Assets influenced by the same economic factors may remain correlated.
3. Assuming Historical Correlation Will Continue
Correlation changes over time.
4. Overestimating International Diversification
Global markets often move together during crises.
5. Ignoring Liquidity Risk
Illiquid assets may appear uncorrelated simply because pricing updates slowly.
Practical Example of Correlation
Investor A
Portfolio:
- 100% U.S. tech stocks
Result:
- High growth potential
- Extremely high correlation
- Higher volatility
Investor B
Portfolio:
- U.S. stocks
- International stocks
- Bonds
- Gold
- REITs
- Cash
Result:
- Lower correlation
- smoother performance
- lower drawdowns
Long-term wealth building becomes more sustainable.
Correlation and Portfolio Construction
Professional portfolio construction involves:
- Asset allocation
- Correlation analysis
- Risk budgeting
- Rebalancing
- Scenario testing
Correlation analysis is foundational.
How Investors Use Correlation
Tactical Allocation
Adjusting allocations based on changing market conditions.
Strategic Allocation
Building long-term diversified portfolios.
Hedging
Using negatively correlated assets to reduce risk.
Risk Management
Reducing concentration exposure.
Correlation and Rebalancing
Rebalancing maintains portfolio diversification.
Example:
- Stocks outperform bonds.
- Portfolio becomes more stock-heavy.
- Correlation risk rises.
Rebalancing restores intended exposure.
Real-Life Example: 2008 Financial Crisis
During the Global Financial Crisis:
- U.S. equities collapsed
- International equities also fell
- Real estate crashed
- Commodities declined
Many investors discovered their portfolios were more correlated than expected.
Government bonds became one of the few effective diversifiers.
Real-Life Example: 2022 Inflation Shock
In 2022:
- Stocks fell
- Bonds also fell
This surprised many investors because stock-bond negative correlation weakened.
Why?
Because:
- Inflation surged
- Interest rates rose rapidly
- Central banks tightened policy aggressively
This showed that diversification models must evolve.
Correlation and Long-Term Wealth Building
The purpose of understanding correlation is not simply academic.
It helps investors:
- survive bear markets
- preserve capital
- maintain discipline
- compound wealth over decades
Long-term investing success depends heavily on risk management.
Key Takeaways
1. Correlation Measures Asset Relationships
It shows whether assets move together or separately.
2. Diversification Depends on Correlation
Owning many assets is not enough.
3. Correlation Changes Over Time
Economic regimes matter.
4. Low Correlation Can Reduce Portfolio Risk
This improves stability and emotional discipline.
5. Crises Often Increase Correlation
Diversification may weaken during panic periods.
6. Professional Investors Focus Heavily on Correlation
It is central to institutional portfolio management.
Final Thoughts
Portfolio correlation is one of the most powerful concepts in investing because it explains how individual assets behave as a group. Investors who ignore correlation often believe they are diversified when they are actually concentrated in similar risks.
Understanding correlation helps investors build portfolios designed not only for growth, but also for resilience.
For investors in the United States, Canada, United Kingdom, and Australia, where retirement systems increasingly depend on self-directed investing, mastering correlation is essential for long-term financial success.
The most successful portfolios are rarely those chasing the highest short-term returns. Instead, they are portfolios carefully constructed with thoughtful diversification, balanced risk exposure, and intelligent correlation management across economic cycles.