1. Introduction: The Timeless Investment Debate
Few debates in finance last as long—or provoke as much emotion—as growth vs value investing. Understanding the growth vs value investing strategy is essential for long-term investors in the USA, UK, Canada, and Australia. The debate around growth vs value investing performance has shaped portfolio decisions for decades, especially when analyzing historical returns and economic cycles.
When examining growth vs value investing historical data, it becomes clear that different market environments favor different styles.
At its core, this debate is about how investors believe wealth is created:
- Growth investors believe wealth comes from owning tomorrow’s winners today—companies that will reshape industries, dominate markets, and grow exponentially.
- Value investors believe wealth comes from buying today’s mispriced assets—companies that are already profitable, stable, and undervalued due to fear, neglect, or temporary problems.
Both philosophies have produced legendary investors:
- Growth: Peter Lynch, Cathie Wood, early tech venture capitalists
- Value: Benjamin Graham, Warren Buffett, Seth Klarman
Both have endured market crashes, bubbles, booms, and recessions.
Yet the central question remains:
Which strategy actually wins over time—for the average investor in Tier-1 countries like the USA, UK, Canada, Australia, and Western Europe?
To answer this properly, we must go far beyond surface definitions. We need to understand:
- How markets price stocks
- How human psychology influences investment decisions
- How macroeconomic forces (interest rates, inflation, growth) shift performance
- How risk, return, and time interact
This article will guide you through all of that—step by step. It serves as a complete long-term investing strategy comparison, helping investors determine which approach aligns with their time horizon, income needs, and risk tolerance.
2. What Is Growth Investing? (In-Depth Definition and Examples)
2.1 Definition of Growth Investing
Growth investing is an investment strategy that focuses on buying stocks of companies expected to grow faster than the overall market in terms of:
- Revenue
- Earnings
- Market share
- Cash flow
- User base or customer adoption
These companies typically:
- Reinvest most or all of their profits back into the business
- Prioritize expansion, innovation, and market dominance
- Trade at high valuation multiples relative to current earnings
In simple terms:
Growth investors buy companies based on what they are becoming, not just what they are today.
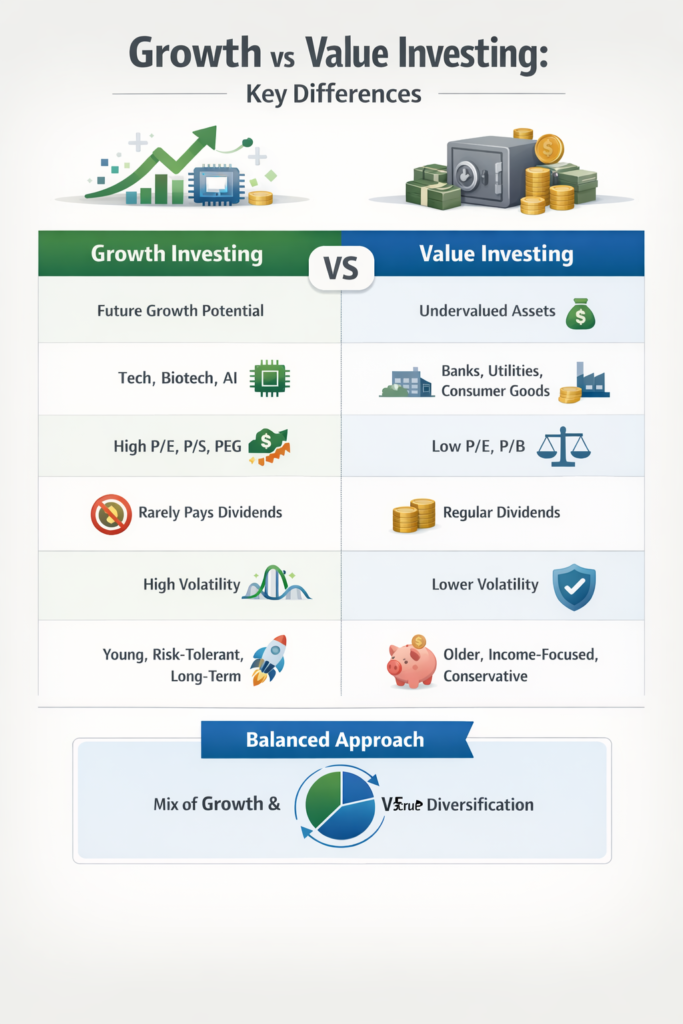
2.2 Key Characteristics of Growth Stocks
| Characteristic | Explanation |
|---|---|
| High Revenue Growth | Sales increase faster than the market average |
| High Earnings Growth | Profits (or projected profits) grow rapidly |
| High Valuation Ratios | P/E, P/S, or EV/EBITDA higher than market averages |
| Low or No Dividends | Profits are reinvested, not distributed |
| High Volatility | Prices swing more due to changing expectations |
| Innovation-Focused | Often in tech, biotech, fintech, AI, or renewable energy |
2.3 Valuation Metrics in Growth Investing (Explained Simply)
Price-to-Earnings (P/E) Ratio
- Formula:
Stock Price ÷ Earnings Per Share (EPS) - A high P/E (e.g., 50 or 100) means investors are paying a lot for each dollar of current earnings—because they expect much higher future earnings.
Price-to-Sales (P/S) Ratio
- Formula:
Market Capitalization ÷ Total Revenue - Used when companies are not yet profitable but are growing sales rapidly.
PEG Ratio (Price/Earnings-to-Growth)
- Formula:
P/E Ratio ÷ Earnings Growth Rate - A PEG below 1 suggests a stock may be undervalued relative to its growth.
2.4 Real-World Growth Stock Examples
Example 1: Amazon (2000–2010)
- Amazon reinvested nearly all profits into:
- Warehouses
- Cloud computing (AWS)
- Logistics infrastructure
- International expansion
- It often reported thin or no profits, causing traditional investors to avoid it.
- Growth investors saw:
- Exploding online retail adoption
- Network effects
- Long-term dominance potential
Result:
Early investors experienced extraordinary capital appreciation.
Example 2: NVIDIA (2016–2025)
- NVIDIA invested heavily in:
- GPUs
- AI infrastructure
- Data centers
- Autonomous driving technology
- Growth investors recognized:
- The explosion of AI workloads
- The company’s near-monopoly in high-performance GPUs
Result:
Stock price multiplied many times, rewarding those who invested early.
Example 3: Tesla (2013–2021)
- Tesla focused on:
- Electric vehicles
- Battery technology
- Autonomous driving
- Energy storage
- Profits were inconsistent early on, but revenue growth was explosive.
Result:
Investors who believed in the future of EVs benefited massively.
2.5 How Growth Investors Make Money
Growth investors primarily earn money through:
- Capital Appreciation – Stock price rises as earnings and expectations grow.
- Multiple Expansion – Investors become willing to pay even higher valuations.
- Compounding Growth – Reinvested profits generate more profits over time.
Unlike income investors, growth investors do not rely on dividends.
3. What Is Value Investing? (In-Depth Definition and Examples)
At its core, any serious growth and value stock comparison must evaluate not just valuation metrics, but also business quality, earnings durability, and macroeconomic sensitivity.
3.1 Definition of Value Investing
Value investing is an investment strategy that focuses on buying stocks that appear undervalued relative to their intrinsic worth based on:
- Earnings
- Cash flow
- Assets
- Dividends
- Business quality
In simple terms:
Value investors buy good companies at cheap prices.
The goal is to benefit from:
- Price appreciation when the stock returns to fair value
- Dividend income
- Compounding through reinvestment
3.2 Key Characteristics of Value Stocks
| Characteristic | Explanation |
|---|---|
| Low Valuation Ratios | Low P/E, P/B, or EV/EBITDA |
| Stable or Moderate Growth | Not fast-growing, but dependable |
| Dividends | Regular income is common |
| Established Businesses | Often mature companies |
| Lower Volatility | Prices tend to fluctuate less |
| Market Mispricing | Often out of favor or misunderstood |
3.3 Valuation Metrics in Value Investing (Explained)
Price-to-Book (P/B) Ratio
- Formula:
Market Price ÷ Book Value per Share - Used heavily in banking, insurance, and asset-heavy industries.
- A P/B below 1 suggests the stock trades for less than its accounting value.
Free Cash Flow (FCF)
- Formula:
Operating Cash Flow – Capital Expenditures - Measures how much cash a company generates after maintaining its business.
- Value investors prefer companies with strong, consistent FCF.
Dividend Yield
- Formula:
Annual Dividend ÷ Stock Price - A higher yield indicates more income, but excessively high yields may signal risk.
3.4 Real-World Value Stock Examples
Example 1: Coca-Cola
- Mature business with:
- Global brand dominance
- Predictable cash flow
- Consistent dividends for decades
- Growth is slow, but stability is high.
Value appeal:
Reliable income + brand moat + reasonable valuation.
Example 2: Bank of America (2009–2013)
- After the financial crisis:
- Bank stocks were deeply depressed
- Many investors feared collapse
- Value investors analyzed:
- Capital adequacy
- Balance sheets
- Long-term profitability
Result:
Those who invested during the downturn saw substantial gains as banks recovered.
Example 3: Procter & Gamble
- Consumer staples company with:
- Strong brands
- Steady demand
- Reliable dividends
- Trades at moderate valuations and provides consistent income.
3.5 How Value Investors Make Money
Value investors earn through:
- Price Appreciation – When the market recognizes the company’s true value.
- Dividends – Regular income regardless of stock price movement.
- Reinvestment – Dividends reinvested compound wealth over time.
4. Financial Metrics Explained: P/E, P/B, P/S, ROE, Free Cash Flow
To fully understand growth vs value investing, you must understand the financial metrics used to evaluate companies.
4.1 Price-to-Earnings (P/E) Ratio
- Measures how much investors are willing to pay for $1 of earnings.
| Interpretation | Meaning |
|---|---|
| High P/E | High growth expectations |
| Low P/E | Possibly undervalued or slow growth |
Example:
- Company A: Price $100, EPS $2 → P/E = 50 (growth)
- Company B: Price $50, EPS $5 → P/E = 10 (value)
4.2 Price-to-Book (P/B) Ratio
- Compares stock price to company’s net asset value.
Used mostly in:
- Banks
- Insurance companies
- Manufacturing firms
Low P/B can indicate undervaluation—or declining business quality.
4.3 Price-to-Sales (P/S) Ratio
- Used when earnings are volatile or negative.
Growth companies often have:
- High P/S ratios because they reinvest heavily and sacrifice current profits.
4.4 Return on Equity (ROE)
- Formula:
Net Income ÷ Shareholder Equity - Measures how efficiently a company uses shareholder capital.
High ROE = strong profitability and business quality.
4.5 Free Cash Flow (FCF)
- Measures how much cash remains after operating expenses and capital investments.
High and consistent FCF:
- Enables dividends
- Enables debt reduction
- Enables share buybacks
- Indicates business strength
5. The Psychology Behind Growth and Value Investing
Investing success depends as much on behavior as on math.
5.1 Growth Investor Psychology
Growth investors are often:
- Optimistic about the future
- Comfortable with uncertainty
- Attracted to innovation and disruption
They believe:
“The future will be better than the past.”
Psychological strengths:
- Willing to take risks
- Comfortable holding volatile assets
- Focused on long-term transformation
Psychological weaknesses:
- Overconfidence
- Susceptibility to hype
- Fear of missing out (FOMO)
- Panic selling during crashes
5.2 Value Investor Psychology
Value investors tend to be:
- Skeptical
- Patient
- Conservative
- Disciplined
They believe:
“Markets overreact, and I profit from their mistakes.”
Psychological strengths:
- Discipline
- Emotional control
- Long-term patience
Psychological weaknesses:
- Excessive pessimism
- Resistance to change
- Missing transformative trends
- Overconfidence in valuation models
5.3 Behavioral Finance Concepts
Loss Aversion
People feel losses twice as strongly as gains.
- Growth investors may panic sell after large drops.
- Value investors may hold declining stocks too long.
Recency Bias
Investors overweight recent events.
- After growth outperforms for years, investors believe growth will always win.
- After value outperforms, investors rotate excessively.
Herd Behavior
People follow the crowd—even when the crowd is wrong.
- Leads to bubbles in growth stocks.
- Leads to excessive pessimism in value stocks during recessions.
6. Growth vs Value Investing Performance: Historical Data Over a Century
The long-term growth vs value investing returns show that value stocks historically outperform over very long periods, but growth stocks dominate during innovation-driven cycles. Investors reviewing growth vs value investing historical data often notice that interest rate trends strongly influence which strategy wins.
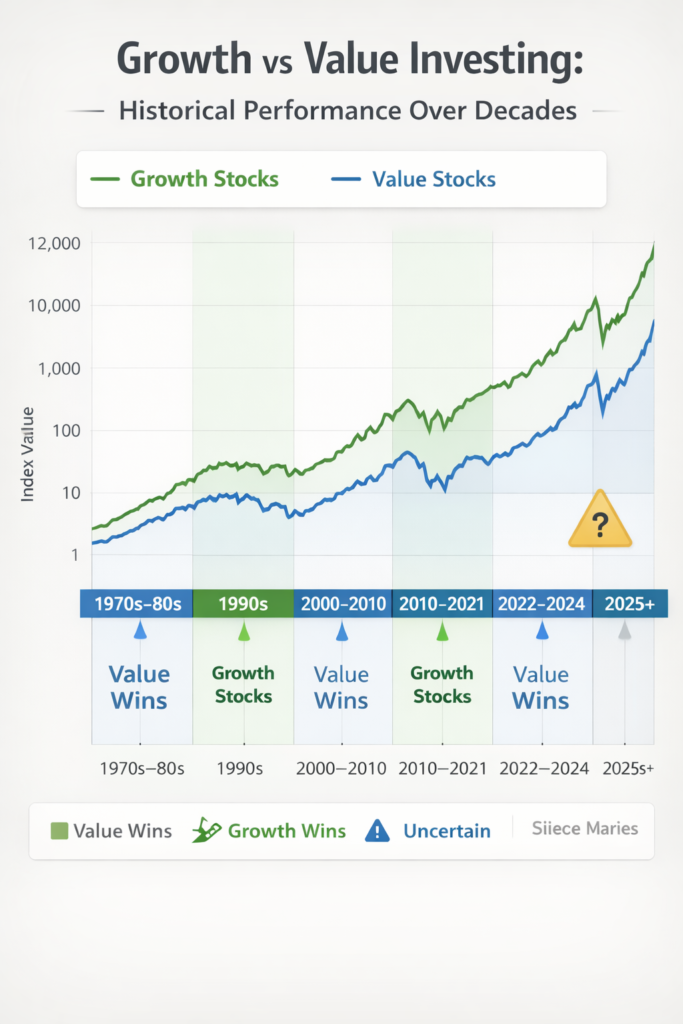
As shown in the historical data above, leadership rotates between growth and value depending on macroeconomic conditions. Periods of low interest rates tend to favor growth stocks, while rising-rate environments historically shift leadership toward value stocks.
6.1 Long-Term Evidence
Academic research (notably by Eugene Fama and Kenneth French) shows:
- Over very long periods, value stocks have historically outperformed growth stocks.
- However, growth stocks dominate during specific eras.
Research by Eugene Fama and Kenneth French through the Fama-French Three-Factor Model provides long-term empirical support for value premiums across developed markets.
6.2 Performance by Decade
| Decade | Winner | Explanation |
|---|---|---|
| 1970s–80s | Value | Inflation, high rates favored income and assets |
| 1990s | Growth | Tech boom, low inflation, internet revolution |
| 2000–2010 | Value | Dot-com crash, growth valuations collapsed |
| 2010–2021 | Growth | Ultra-low rates, tech dominance |
| 2022–2024 | Value | Rising rates, inflation, valuation compression |
| 2025+ | Uncertain | Rate-sensitive and macro-driven environment |
Style box data from Morningstar confirms that leadership rotates between growth and value depending on interest rate cycles and macroeconomic conditions.
Decades of style investing performance data show that leadership rotates between growth and value depending on interest rates, inflation trends, and innovation cycles.
Historical return data from S&P Global shows that growth stocks dominated the 2010–2021 period, while value regained strength during rising-rate environments post-2022.
6.3 Why No Strategy Always Wins
Markets evolve because:
- Technology changes
- Demographics shift
- Monetary policy changes
- Geopolitics changes
- Investor psychology shifts
No single strategy can dominate all environments.
Academic case studies from Harvard Business School highlight how investor psychology and macroeconomic shifts drive recurring style cycles.
7. How Interest Rates, Inflation, and Economic Cycles Affect Each Style
To understand this dynamic in more detail, read How Inflation Affects the Stock Market.
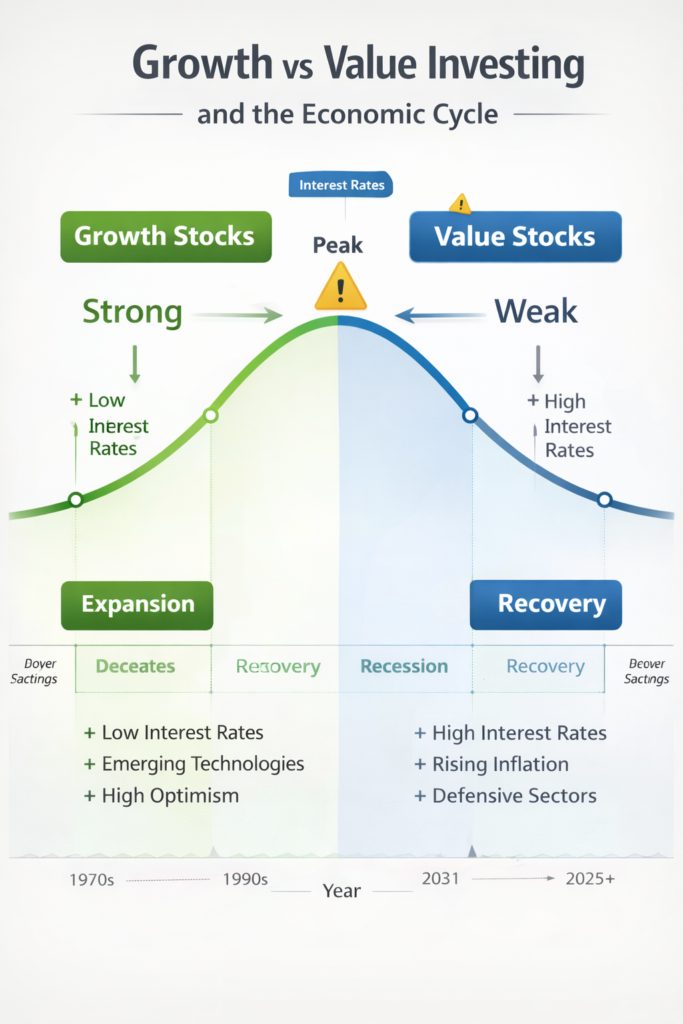
7.1 Interest Rates
Interest rates determine how future earnings are valued.
- Low rates → future cash flows are worth more → growth stocks benefit
- High rates → future cash flows are discounted more → value stocks benefit
7.2 Inflation
Inflation erodes the purchasing power of future earnings.
- Growth stocks depend heavily on future profits, making them vulnerable to inflation.
- Value stocks often:
- Own real assets
- Generate current cash flow
- Pay dividends
- Operate in defensive sectors
7.3 Economic Cycles
| Phase | Growth Performance | Value Performance |
|---|---|---|
| Expansion | Strong | Moderate |
| Peak | Volatile | Stable |
| Recession | Weak | Strong |
| Recovery | Strong | Moderate |
8. Growth vs Value Investing Risk Comparison: Volatility, Drawdowns, Beta, and Recovery Time
A proper growth vs value investing risk comparison reveals that growth stocks typically experience deeper drawdowns but faster recoveries, while value stocks provide steadier returns with lower volatility.
8.1 Volatility
- Growth stocks: High volatility (price swings large)
- Value stocks: Lower volatility (price swings smaller)
8.2 Drawdowns
A drawdown is the peak-to-trough decline in a portfolio.
- Growth portfolios can experience 40–70% drawdowns during crashes.
- Value portfolios often experience 20–40% drawdowns.
8.3 Beta
Beta measures how a stock moves relative to the market.
- Beta > 1 → More volatile than the market (growth stocks)
- Beta < 1 → Less volatile than the market (value stocks)
8.4 Recovery Time
- Growth stocks often recover faster after crashes due to:
- Innovation
- Earnings growth
- Investor optimism
- Value stocks recover more steadily but slowly.
9. Who Should Choose Growth Investing?
Growth investing is best suited for:
- Young investors (20s–40s)
- Long investment horizon (15–30+ years)
- High income and savings rate
- High risk tolerance
- No immediate need for income
Growth Investor Profile Example
Age: 28
Income: $90,000/year
Goal: Maximize long-term wealth
Risk tolerance: High
Time horizon: 30 years
Portfolio:
- 70% growth ETFs (NASDAQ-100, global growth)
- 20% international growth stocks
- 10% speculative/emerging technologies
10. Who Should Choose Value Investing?
For income-focused investors, explore our list of Best Dividend Stocks for Passive Income.
Value investing is best suited for:
- Middle-aged and retired investors
- Those seeking income
- Lower risk tolerance
- Shorter time horizon
- Capital preservation focus
Value Investor Profile Example
Age: 60
Income: Semi-retired
Goal: Stable income + capital preservation
Risk tolerance: Low
Time horizon: 15 years
Portfolio:
- 60% dividend-paying blue chips
- 25% value ETFs
- 15% bonds and REITs
11. Blended Growth vs Value Investing Strategy for Long-Term Investors
Most professional investors use both growth and value.
This is called:
- Style diversification
- Factor investing
- Core-satellite investing
11.1 Blended Portfolio Example
- 40% growth stocks
- 40% value stocks
- 20% bonds or alternatives
Benefits:
- Reduces volatility
- Improves risk-adjusted returns
- Performs reasonably well in all environments
A disciplined growth vs value portfolio allocation allows investors to balance capital appreciation with income generation, especially during uncertain economic cycles.
11.2 Factor Investing Approach
Instead of choosing growth or value, investors allocate across factors:
- Value
- Growth
- Momentum
- Quality
- Low volatility
- Size (small-cap)
This approach:
- Smooths performance
- Reduces dependence on any single style
12. Sector Breakdown: Where Growth and Value Typically Operate
Growth-Oriented Sectors
- Technology
- Biotechnology
- Fintech
- Artificial intelligence
- Renewable energy
- Consumer discretionary (e.g., luxury, e-commerce)
These sectors benefit from:
- Innovation
- Network effects
- Scalability
Value-Oriented Sectors
- Financials (banks, insurers)
- Energy (oil, gas, utilities)
- Consumer staples (food, household goods)
- Industrials (manufacturing, infrastructure)
- Telecommunications
These sectors benefit from:
- Stable demand
- Physical assets
- Regulated markets
13. Case Studies: Real Investors, Real Outcomes, Real Lessons
Case Study 1: The Tech Visionary (Growth)
Profile:
30-year-old software engineer in California
Invested heavily in tech ETFs and AI stocks.
Experience:
- Portfolio surged during tech booms.
- Lost 40% during market corrections.
- Held through downturns.
Outcome:
- Long-term wealth significantly outperformed market average.
Lesson:
Growth investing rewards patience and emotional resilience.
Case Study 2: The Income Builder (Value)
Profile:
55-year-old professional in the UK nearing retirement.
Experience:
- Stable dividends funded lifestyle.
- Portfolio declined modestly during crashes.
- Missed some high-growth gains.
Outcome:
- Achieved financial security and peace of mind.
Lesson:
Value investing rewards discipline and stability.
14. Common Mistakes Investors Make (With Behavioral Explanations)
Growth Investing Mistakes
| Mistake | Why It Happens |
|---|---|
| Buying hype | Herd behavior |
| Overpaying | FOMO |
| Panic selling | Loss aversion |
| Overconcentration | Overconfidence |
Value Investing Mistakes
| Mistake | Why It Happens |
|---|---|
| Buying value traps | Confirmation bias |
| Avoiding growth | Conservatism bias |
| Holding losers too long | Sunk cost fallacy |
| Overemphasizing price | Neglecting business quality |
15. How to Build a Growth or Value Portfolio Step-by-Step
Step 1: Define Your Financial Goals
Ask:
- Do I want maximum long-term wealth?
- Do I want stable income?
- Do I want balanced performance?
Step 2: Assess Your Risk Tolerance
Ask:
- Can I emotionally handle a 40–60% drop?
- Would I panic sell?
- Do I need my investments for income?
Step 3: Choose Investment Vehicles
- ETFs: Low cost, diversified, ideal for most investors
- Individual stocks: Higher risk, requires analysis
- Mutual funds: Actively managed, higher fees
If you’re new to exchange-traded funds, read our complete guide on How to Invest in ETFs for Beginners.
Step 4: Allocate Assets
Use age- and goal-based guidelines:
| Age | Growth | Value | Bonds |
|---|---|---|---|
| 25 | 80% | 20% | 0% |
| 45 | 50% | 40% | 10% |
| 65 | 30% | 50% | 20% |
Step 5: Rebalance Annually
Rebalancing:
- Restores your intended risk profile
- Forces you to sell high and buy low
- Prevents emotional decision-making
Many investors combine rebalancing with What Is Dollar-Cost Averaging? to reduce timing risk.
16. Final Verdict: Which Strategy Truly Wins Over Time?
A proper growth vs value investing risk comparison reveals that growth stocks typically experience deeper drawdowns but faster recoveries, while value stocks provide steadier returns with lower volatility.
There is no permanent winner between growth and value investing.
Each strategy:
- Wins during different economic regimes
- Aligns with different investor goals and personalities
- Offers unique advantages and risks
For most investors in Tier-1 economies, combining a disciplined growth vs value investing strategy with long-term consistency is the real path to sustainable wealth creation.
The True Winner Over Time?
The investor who stays invested, diversified, disciplined, and emotionally resilient.
History proves:
- Growth wins during innovation booms and low-rate environments.
- Value wins during inflation, rising rates, and economic slowdowns.
- Blended strategies deliver the best risk-adjusted returns across full market cycles.
Ultimately, the debate over value vs growth stock returns highlights a deeper truth: returns depend more on timing, discipline, and diversification than on choosing a permanent winner.
Final Recommendation
For most investors in Tier-1 countries:
✔ Use growth investing to maximize long-term wealth
✔ Use value investing to generate income and stability
✔ Combine both to create a resilient, all-weather portfolio
The long-term growth vs value investing performance cycle proves no single strategy dominates forever. Growth vs value investing performance shifts based on economic cycles, interest rates, and investor psychology. Smart investors analyze growth vs value investing historical data, assess their personal risk tolerance, and build a balanced growth vs value investing strategy accordingly.